|
|
|
AGENDA
Te Whakaminenga o Kāpiti
Tuesday, 30 June 2020
|
|
I hereby give notice that a Te Whakaminenga o Kāpiti meeting will be held on:
|
|
Date:
|
Tuesday, 30 June 2020
|
|
Time:
|
9.30am
|
|
Location:
|
Council Chamber
Ground Floor, 175 Rimu Road
Paraparaumu
|
|
Janice McDougall
Group Manager People and
Partnerhips
|
|
Te
Whakaminenga o Kāpiti Agenda
|
30 June 2020
|
Kapiti Coast District Council
Notice
is hereby given that a meeting of Te Whakaminenga o Kāpiti will be held in the Council
Chamber, Ground Floor, 175 Rimu Road, Paraparaumu, on Tuesday 30 June 2020,
9.30am.
Te Whakaminenga o
Kāpiti Members
|
Mr Rupene Waaka
|
Chair
|
|
Ms Carol Reihana
|
Member
|
|
Mr Andre Baker
|
Member
|
|
Mayor K Gurunathan
|
Member
|
|
Cr James Cootes
|
Member
|
|
Ms Naomi Solomon
|
Member
|
|
Mr Chris Gerretzen
|
Member
|
|
Ms Natalia Repia
|
Member
|
5 Confirmation
of Minutes
5.1 Confirmation
of minutes
Author: Tanicka
Mason, Democracy Services Advisor
Authoriser: Leyanne
Belcher, Democracy Services Manager
|
Recommendations
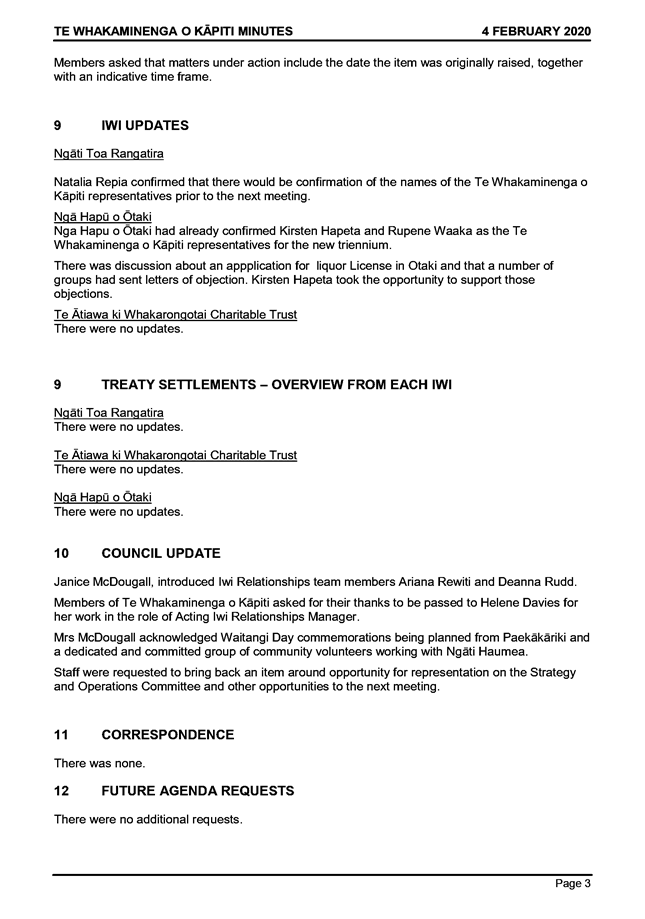
That the minutes of the Te
Whakaminenga o Kāpiti meeting on 4 February 2020 be accepted as a true
and accurate record of the meeting.
|
Appendices
1. Minutes
of Te Whakaminega o Kāpiti 04/02/2020 ⇩ 
|
Te
Whakaminenga o Kāpiti Agenda
|
30 June 2020
|
6 Updates
6.1 Appointment
of Chair
6.2 Representation
on the Strategy and Operations Committee and other opportunities
6.3 The
COVID-19 Recovery
6.4 Wellington
Region Waste Management and Minimisation Bylaw Template
6.5 Provincial
Growth Fund
7 Reports
7.1 Local
Place Names - New Zealand Geographic Board
Author: Aston
Mitchell, Policy Advisor
Authoriser: Janice
McDougall, Group Manager People and Partnerhips
Purpose of Report
1 The
purpose of this report is to provide information and seek feedback on an
advisory from the New Zealand Geographic Board (NZGB) to make local recorded
place names official.
Delegation
2 Te
Whakaminenga o Kāpiti may consider this matter under the Memorandum of
Partnership.
Background
3 The
NZGB is New Zealand’s place naming authority, and is an independent
statutory board that Land Information New Zealand (LINZ) administers. They
operate under the New Zealand Geographic Board (Ngā Pou Taunaha o
Aotearoa) Act 2008 (the Act), which provides for the NZGB to approve unofficial
recorded place names as official. Under S24 of the Act there is a fast track
process to convert non-controversial, unofficial recorded place names that do
not have any other known alternative names to official. Earlier in 2019 the
NZGB used this process to make over 800 place names official across New
Zealand.
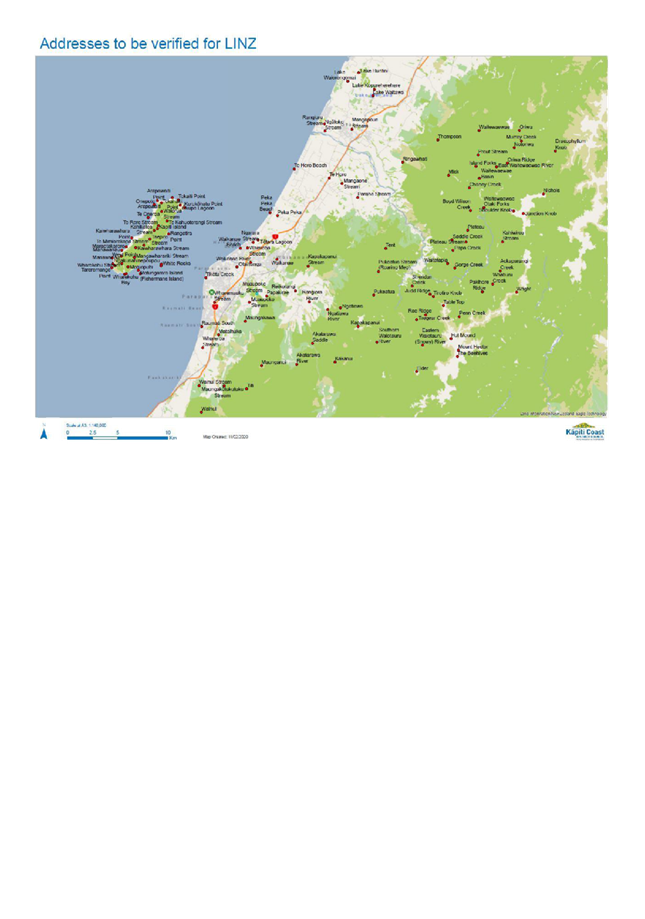
4 A
separate process has since been initiated to make the remaining unofficial
recorded place names across the Wellington Region official. As part of this
process, the NZGB have sought comment from Kāpiti Coast District Council
on the list of names in the district. Appendix 1 to this report, includes a
list of 120 place names. 76 are identified as currently recorded, 8 have had
macrons added, and 36 have already identified alternative spellings, or the
need for further information for correct interpretation. The focus of the
current advisory is on making those place names that don’t have
identified issues official. Where there are issues identified with any of the
names, for example incorrectly spelling, another name is known for a place or
feature, or a name might be considered controversial, it will remain as
unofficial.
5 NZGB
have also sought feedback on the proposed names directly from iwi within the
district including Ngāti Toa, Ngāti Raukawa ki te Tonga, and Te Āti Awa ki Whakarongotai.
discussion
6 Staff
have undertaken an initial assessment of the list of recorded names in
discussion with the Iwi Partnerships team and library historians. This has
identified some potential differences to the spelling of names across the three
lists.
7 Council
would like to discuss and confirm any changes with Te Whakaminenga o
Kāpiti before providing feedback on the list of place names to NZGB.
Considerations
Policy
considerations
8 Only
place names that change will have a potential impact on Council. Changes to
place names will have an impact on existing policy documents, such as the
District Plan. Where necessary, place name changes will be captured and updated
as part of future plan update processes.
Legal
considerations
9 There
are no legal considerations arising from this report.
Financial
considerations
10 Any
names that do not change will not impact financially as it will be a continuation
of the status quo.
11 Any
names that are made official and change from their recorded spelling (either
alternate spellings or the addition of macrons where none currently exist),
will have a small impact financially – i.e. updating any relevant signage
over time, updating the District Plan during the next planning process.
Tāngata
whenua considerations
12 This
paper seeks input from Te Whakaminenga o Kāpiti to ensure that any
feedback on place names accurately reflects the local iwi interpretation and
meaning.
Strategic
considerations
13 Toitū
Kāpiti reflects aspirations for a vibrant and thriving Kāpiti,
with strong and safe communities that are connected to our natural environment.
Local place names are a part of what makes us Kāpiti, our distinct
district identity, and it is important that we get them right.
Significance and Engagement
Significance
policy
14 This
matter has a low level of significance under Council’s Significance and
Engagement policy, as Council is not the decision-making body for official
place names in New Zealand.
15 NZGB
have processes whereby any errors or proposed name changes can be raised and
considered.
Consultation
already undertaken
16 No
external consultation has occurred.
Publicity
17 There
are no publicity considerations arising from this report.
|
Recommendations
18 Note the place names NZGB
has proposed to make official as shown in Appendix 1 to this report.
19 Advise which proposed
official place names in Appendix 1 to this report, can be accepted, as is.
20 Advise which proposed
official place names in Appendix 1 to this report require alteration,
including if names should have macrons added and/or an alternative spelling.
21 Provide feedback on
suggested alternatives for names in Appendix 1 to this report, if required.
|
Appendices
1. Appendix
1 - Place Names
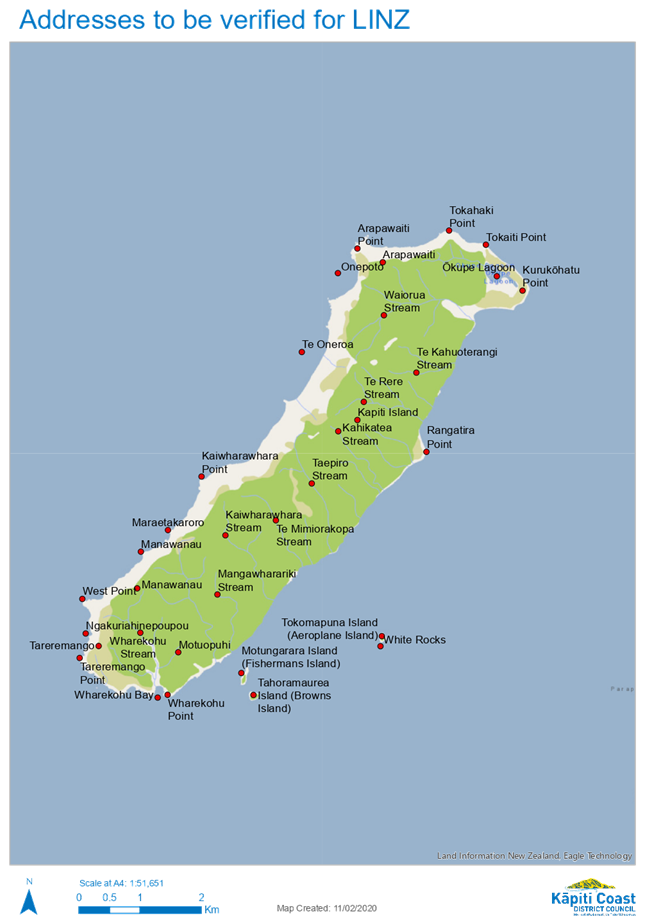
2. Mapped
Place Names
3. Mapped
Place Names - Kapiti Island
|
Te
Whakaminenga o Kāpiti Agenda
|
30 June 2020
|
APPENDIX
1
|
Names as currently
recorded
|
Feature type
|
NZTopo50
grid reference
|
Comments
|
|
Aokaparangi Creek
|
Stream
|
BP33
962721
|
|
|
Arapawaiti
|
Hill
|
BN32
624789
|
|
|
Arapawaiti Point
|
Point
|
BN32
620791
|
|
|
Boyd-Wilson Creek
|
Stream
|
BN33 932781
|
|
|
Chaney Creek
|
Stream
|
BN33
931804
|
|
|
Dracophyllum Knob
|
Hill
|
BN33
017840
|
|
|
East Waitewaewae
River
|
Stream
|
BN33
966834
|
|
|
Elder
|
Hill
|
BP33
879620
|
|
|
Gorge Creek
|
Stream
|
BP33
917724
|
|
|
Hut Mound
|
Hill
|
BP33
913653
|
|
|
Island Forks
|
Place
|
BN33
938825
|
|
|
Judd Ridge
|
Ridge
|
BP33
892697
|
|
|
Junction Knob
|
Hill
|
BP33
985778
|
|
|
Kahikatea Stream
|
Stream
|
BP32
620757
|
|
|
Kaiwharawhara Point
|
Point
|
BP32
594754
|
|
|
Kaiwharawhara
Stream
|
Stream
|
BP32
602741
|
|
|
Kahiwiroa Stream
|
Stream
|
BP33
972755
|
|
|
Kapakapanui
|
Hill
|
BP33
820665
|
|
|
Kapakapanui Stream
|
Stream
|
BP32
770725
|
|
|
Lake Waiorongomai
|
Lake
|
BN33
810910
|
|
|
Lake Waitawa
|
Lake
|
BN33
835896
|
|
|
Mangaone Stream
|
Stream
|
BN33
804808
|
|
|
Mangawharariki
Stream
|
Stream
|
BP32
600732
|
|
|
Maraetakaroro
|
Point
|
BP32
589745
|
|
|
Maungakawa
|
Hill
|
BP32
708670
|
|
|
Maunganui
|
Hill
|
BP32
724626
|
|
|
Mick
|
Hill
|
BN33
910816
|
|
|
Mount Hector
|
Hill
|
BP33
920641
|
|
|
Muaupoko Stream
|
Stream
|
BP32
720702
|
|
|
Murray Creek
|
Stream
|
BN33
987845
|
|
|
Nichols
|
Hill
|
BN33
005798
|
|
|
Onepoto
|
Bay
|
BN32
617787
|
|
|
Pakihore Ridge
|
Range
|
BP33
944700
|
|
|
Papakirae
|
Hill
|
BP32
729696
|
|
|
Penn Creek
|
Stream
|
BP33
924687
|
|
|
Plateau
|
Hill
|
BP33
929761
|
|
|
Plateau Stream
|
Stream
|
BP33
928750
|
|
|
Prout Stream
|
Stream
|
BN33
940836
|
|
|
Rae Ridge
|
Ridge
|
BP33
888677
|
|
|
Rangatira Point
|
Point
|
BP32
631758
|
|
|
Rangiuru Stream
|
Stream
|
BN32
787868
|
|
|
Raumati South
|
Town
|
BP32
664665
|
|
|
Ringawhati
|
Hill
|
BN33
865829
|
|
|
Saddle Creek
|
Stream
|
BP33
914752
|
|
|
Sheridan Creek
|
Stream
|
BP33
876701
|
|
|
Shoulder Knob
|
Hill
|
BN33
975780
|
|
|
Table Top
|
Hill
|
BP33
905686
|
|
|
Taepiro Stream
|
Stream
|
BP32
612752
|
|
|
Te Horo
|
Locality
|
BN32
791813
|
|
|
Te Horo Beach
|
Locality
|
BN32
759821
|
|
|
Te Kahuoterangi
Stream
|
Stream
|
BP32
629771
|
|
|
Te Oneroa
|
Bay
|
BP32
612772
|
|
|
Te Rere Stream
|
Stream
|
BP32
625765
|
|
|
Tent
|
Hill
|
BP33
848743
|
|
|
The Beehives
|
Hill
|
BP33
919635
|
|
|
Thompson
|
Hill
|
BN33
900851
|
|
|
Tirotiro Knob
|
Hill
|
BP33
895695
|
|
|
Tokaiti Point
|
Point
|
BN32
641792
|
|
|
Tregear Creek
|
Stream
|
BP33
885661
|
|
|
Waikanae
|
Town
|
BP32
739732
|
|
|
Waikanae Beach
|
Town
|
BP32
703743
|
|
|
Waikanae River
|
Stream
|
BP32
763705
|
|
|
Waimeha Stream
|
Stream
|
BP32
710744
|
|
|
Wainui
|
Hill
|
BP32
664580
|
|
|
Wainui Stream
|
Stream
|
BP32
662606
|
|
|
Waitewaewae
|
Hill
|
BN33
941861
|
|
|
Waitewaewae Basin
|
Valley
|
BN33
941813
|
|
|
West Point
|
Point
|
BP32
575734
|
|
|
Wharekohu Bay
|
Bay
|
BP32
587718
|
|
|
Wharekohu Point
|
Point
|
BP32
589718
|
|
|
Wharekohu Stream
|
Stream
|
BP32
584728
|
|
|
Wharemauku Stream
|
Stream
|
BP32
677689
|
|
|
Whareroa Stream
|
Stream
|
BP32
665644
|
|
|
Whatiuru Creek
|
Stream
|
BP33
954708
|
|
|
White Rocks
|
Rock
|
BP32
624726
|
|
|
Wright
|
Hill
|
BP33
978699
|
|
|
Names with Macrons
added
|
Feature type
|
NZTopo50
grid reference
|
Comments
|
|
Kākānui
|
Hill
|
BP32
797630
|
|
|
Kurukōhatu
Point
|
Point
|
BN32
647784
|
|
|
Mangapōuri
Stream
|
Stream
|
BN33
814862
|
|
|
Maungakōtukutuku
Stream
|
Stream
|
BP32
709647
|
|
|
Ngātoko Stream
|
Stream
|
BN32
787860
|
|
|
Ōkupe Lagoon
|
Lake
|
BN32
643786
|
|
|
Tōtara Lagoon
|
Lake
|
BP32
720752
|
|
|
Waitewaewae
Ōtaki Forks
|
Place
|
BN33
946784
|
|
|
Names with
Suggested Alternatives/Potential Alternatives
|
Feature type
|
NZTopo50
grid reference
|
Comments
|
|
Akatarawa
River
|
Stream
|
BP32
759627
|
Akatarewa;
Akatārewa
|
|
Akatarawa
Saddle
|
Pass
|
BP32
775648
|
Akatarewa;
Akatārewa
|
|
Eastern
Waiotauru (Snowy) River
|
Stream
|
BP33
891642
|
Issue with
brackets
|
|
Kapiti
Island
|
Island
|
BP32
620763
|
Shortened
form
|
|
Lake
Huritini
|
Lake
|
BN33
821919
|
Translator
requires more info
|
|
Lake
Kopureherehere
|
Lake
|
BN33
836902
|
Translator
requires more info
|
|
Manawanau
|
Point
|
BP32
584735
|
Translator
requires more info
|
|
Manawanau
|
Hill
|
BP32
584741
|
Translator
requires more info
|
|
Mataihuka
|
Hill
|
BP32
681657
|
Translator
requires more info
|
|
Motungarara
Island (Fishermans Island)
|
Island
|
BP32
601720
|
Issue
with brackets
|
|
Motuopuhi
|
Hill
|
BP32
590725
|
Translator
requires more info
|
|
Ngakuriahinepoupou
|
Rock
|
BP32
575728
|
Translator
requires more info
|
|
Ngarara
Stream
|
Stream
|
BP32
722755
|
Translator
requires more info
|
|
Ngatiawa
|
Hill
|
BP33
802684
|
Translator
requires more info
|
|
Ngatiawa
River
|
Stream
|
BP32
790682
|
Translator
requires more info
|
|
Notoriwa
|
Hill
|
BN33
976844
|
Translator
requires more info
|
|
Oriwa
|
Hill
|
BN33
981861
|
Translator
requires more info
|
|
Oriwa
Ridge
|
Ridge
|
BN33
969828
|
Translator
requires more info
|
|
Otaihanga
|
Locality
|
BP32
699725
|
Translator
requires more info
|
|
Papa
Creek
|
Stream
|
BP33
915741
|
Translator
requires more info
|
|
Paraha
Stream
|
Stream
|
BN33
820794
|
Translator
requires more info
|
|
Peka
Peka
|
Locality
|
BP32
740776
|
Correctly
Pekapeka
|
|
Peka
Peka Beach
|
Beach
|
BP32
732779
|
Correctly
Pekapeka
|
|
Pukeatua
Stream (Roaring Meg)
|
Stream
|
BP33
855728
|
Issue
with brackets
|
|
Reikorangi
|
Locality
|
BP32
758701
|
Translator
requires more info
|
|
Southern
Waiotauru River
|
Stream
|
BP33
839649
|
Translator
requires more info
|
|
Tahoramaurea
Island (Browns Island)
|
Island
|
BP32
603718
|
Issue
with brackets
|
|
Tareremango
|
Hill
|
BP32
577726
|
Translator
requires more info
|
|
Tareremango
Point
|
Point
|
BP32
574724
|
Translator
requires more info
|
|
Te
Mimiorakopa Stream
|
Stream
|
BP32
606746
|
Translator
requires more info
|
|
Tikotu
Creek
|
Stream
|
BP32
668714
|
Translator
requires more info
|
|
Titi
|
Hill
|
BP32
709603
|
Translator
requires more info
|
|
Tokahaki
Point
|
Point
|
BN32
635794
|
Translator
requires more info
|
|
Tokomapuna
Island (Aeroplane Island)
|
Island
|
BP32
624727
|
Issue
with brackets
|
|
Waiorua
Stream
|
Stream
|
BN32
624780
|
Translator
requires more info
|
|
Waitatapia
|
Hill
|
BP33
909728
|
Translator
requires more info
|
|
Te Whakaminenga o Kāpiti Agenda
|
30 June 2020
|
|
Te
Whakaminenga o Kāpiti Agenda
|
30 June 2020
|
7.2 Te
Whakaminenga o Kāpiti Annual Work Plan 2019-2020 Update
Author: Deanna
Rudd, Programme Advisor, Iwi Partnerships
Authoriser: Janice McDougall, Group Manager People and Partnerships
Purpose of Report
1 This reports seeks to
update Te Whakaminenga o Kāpiti on the delivery of the Te Whakaminenga o
Kāpiti (TWoK) Annual Work Plan for 2019/20. It also seeks
endorsement of changes to the Annual Work Plan and repurposing of the
associated budget.
Delegation
2 Te Whakaminenga o
Kāpiti may consider this matter under the Memorandum of Partnership (MoP).
Background
3 The TWoK Annual Work
Plan identifies projects considered priorities over a financial year. An
annual budget complements the implementation of the projects.
4 Activities in the TWoK
Annual Work Plan align to the principles from the tangata whenua vision
including Te Reo Māori, Kotahitanga, Kaitiakitanga and Rangatiratanga. Key
projects include Te Reo Māori, Waitangi Day, Māori Economic Development,
Capacity Building, the Annual Maramataka, Wāhi Tapu and Heritage Trail.
5 A copy of the Te
Whakaminenga o Kāpiti Annual Work Plan for 2019/20 is attached with
updates on each of the delivery areas, as Appendix One. This work programme was
approved by TWoK on 3 September 2019.
Issues and Options
Issues
6 The combination of
resourcing challenges and COVID-19 disruption have resulted in some elements of
the TWoK work plan not being able to be delivered this year.
7 Delivery of the work
programme during the first half of 2019 was impacted by reduced resourcing
levels while recruitment and appointment of the new Iwi Partnerships Team
(three staff) was completed. The Interim Iwi Relationships Manager
(sole-charge) was able to prioritise the most significant projects during that
time.
8 The new Iwi Partnership
Team commenced employment in the last week of January and the first week of
February 2020.
9 It is noted that at
11.59pm on 25 March 2020, New Zealand went into Level 4 COVID-19
lockdown. This impacted on the ability of the Iwi Partnership Team to
continue business as usual, including to deliver on the 2019/20 TWoK Annual
Work Plan.
10 The suddenness of the move to Level
4 COVID-19 necessitated tangata whenua having to scramble to implement iwi
responses.
11 During the last week of March and
into April 2020, the Iwi Partnership Team prioritised assisting with iwi
responses. One member of the Iwi Partnership Team was reassigned to
assist the Council’s emergency response team, as part of the overall
Council response.
12 Following a request from Te
Āti Awa for funding support for their COVID-19 Response, Council officers
explored options for repurposing unspent budget dedicated for delivering
priority projects for iwi via the TWoK work programme to support the COVID-19
Response of all three iwi partners.
13 Iwi and Council representatives to
TWoK met remotely with staff on 9 April 2020. Staff advised they had identified
around $30,000 budget relating to work that would not progress by the end of
the financial year that could be repurposed to support the iwi response.
14 TWoK representatives then suggested
that a further $63,000 allocated to Māori Economic Development Grants be
redirected to support the iwi to respond to COVID-19 and create capacity for
recovery planning. This was on the basis that the usual grants application
process would not be possible due to COVID-19 restrictions. The allocation of
the Māori Economic Development Grants is approved annually by TWoK through
its approval of the TWoK work progamme and appointment of a panel to consider
and allocate the grants.
15 Staff advice to the iwi
representatives was that this could be progressed and then formally ratified by
TWoK when it next met. This was in the context of other decisions being made
around the Council’s overall COVID-19 support package.
16 A total of $30,000 was paid to each
iwi.
Considerations
Policy considerations
There are no
policy considerations.
Legal considerations
17 There are no legal considerations.
Financial considerations
18 As noted above, under Level 4
COVID-19, consideration was given to repurpose portions of the unused budget
previously allocated to complement implementation of identified projects under
the TWoK Annual Work Plan for 2019/20 to support Tangata Whenua iwi responses
to COVID-19, including the development of iwi COVID-19 Response plans.
19 Sufficient provision existed in the
budget to support consideration of an amendment to the TWoK work programme
under Level 4 COVID-19.
Tangata whenua considerations
20 Under the MoP, the Council
recognises the special status of the tangata whenua as separate and distinct
from other interest groups. The Council recognises the need for active
protection of tangata whenua interests to be considered in its dealings with
other parties.
Significance and Engagement
Significance policy
21 This matter has a low level of
significance under Council’s Significance and Engagement Policy.
Engagement planning
Consultation already undertaken
22 TWoK were consulted on the work
plan for 2019/20.
23 TWoK were consulted on the proposed
amendments to the work plan and budgets in response to COVID-19.
.
Publicity
24 There has been an Official
Information Request from a ratepayer in relation to the repurposing of funds to
support the iwi response to COVID-19.
Other Considerations
25 COVID-19 has had a significant
impact on Tangata Whenua, and some consideration will need to be given by TWoK
and Council to determine how the Tangata Whenua iwi can be supported during the
rebuilding phase following a return to Level 1 under COVID-19.
26
|
Recommendations
1 That Te Whakaminenga o
Kāpiti receives and approves the updates on the 2019/20 TWoK Annual Plan
2 That
Te Whakaminenga o Kāpiti endorses the changes made to the 2019/20 Annual
Work Plan and the changes to the financial resourcing.
3 That
Te Whakaminenga o Kāpiti endorses the payment of $30,000 each to Ngā Hapu o Ōtaki; Te Atiawa ki Whakarongotai Charitable
Trust and Te Runanga o Toa Rangatira to support COVID-19 reponse and recovery
planning.
|
Appendices
1. Te
Whakaminenga o Kāpiti 2019-2020 Annual Work Plan with Updates ⇩ 
|
Te
Whakaminenga o Kāpiti Agenda
|
30 June 2020
|
Te Whakaminenga o Kāpiti Annual Work
Plan 2019-2020
Te Āti Awa ki Whakarongotai
Ngā Hapū o Ōtaki
Ngāti Toa Rangatira
And
The Kāpiti Coast District Council
Kaupapa
|
Comments/tasks
|
Budget 19/20
|
Organisational
Budget
|
By
Whom
|
By
When
|
Actioned/
Under Action/ Completed
|
|
1. Kaitiakitanga
|
District Plan
· Development –
iwi management plan as a combined three iwi plan or with each iwi.
· It is anticipated
this will take up to 18 months to develop.
|
$10,591
$84,730
|
Te Whakaminenga
District Plan
|
Iwi
Relationships and Research Policy and Planning
|
Ongoing
|
|
1.
Working Parties |
· MED
· District Plan
· Water
· Town Centres
· Integration project
· Community
Staff
time
|
Funded from projects
|
Relevant
Activity Manager with support from IR Manager
|
Ongoing
|
|
1.
Urupā |
§ Annual grant to the
four hapū managed urupā
· Ruakōhatu
· Takamore
· Tainui
· Rangiātea
$3015
$3015
$3015
$3015
|
Open Spaces
|
IR
team member
|
End
of financial year
|
Completed.
Grants Paid 2019
|
|
2. Capacity
Building
|
Build iwi capacity
in resource management
§ Attendance at
relevant Conferences
§ Resource Management
Training
|
$4,750
|
Te Whakaminenga
|
IR
Manager
|
End
of financial year
|
|
1.
Iwi Consultation |
· Building capacity
for the mandated iwi organisations in direct consultation on iwi matters of
significance
· Building capacity
for iwi to respond to consent process under the Resource Management Act.
$21,182
$36,010
$21,182
|
Te Whakaminenga
Resource Consents
team
|
IR
Manager/ Vijay Soma
|
July
–December 2019
|
Under
Action by IP Team for Iwi Capacity Payments to be made by 30 June 2020
|
1.
Democratic process |
§ Review of
remuneration for governance and working party
§ Memorandum of
Partnership
§ Terms of Reference
§ Māori
representation to Standing committees
§ Māori Wards
Staff
time
|
Democratic Services
|
Vyvien
Starbuck-Maffey
|
Ongoing
|
|
1.
Governance meeting support |
§ Te Whakaminenga o
Kāpiti
§ ART Forum
$8,014
$8,014
|
Governance
Te Whakaminenga
|
Vyviene
Starbuck-Maffey
|
End
of financial year
|
|
1.
Communication |
· Half yearly
newsletter produced and disseminated to the community
· Upload to
Council’s website.
$2,290
|
Te Whakaminenga
|
IR
Manager
|
End
of financial year
|
Newsletter
to be revamped by IP Team for 2020/2021 following confirmation of TWoK
committee for 2019-2022 triennium at 30 June 2020 TWoK meeting.
|
1.
LINZ |
§ Annual subscription
for each iwi (up to 2 each)
§ Monthly LINZ search
– for each iwi.
$3,177
|
Te Whakaminenga
|
IR
Manager
|
End
of financial year
|
|
|
3. Māori
Economic Development
|
Strategy
§ Strategy review and
Refresh (external funding for refresh)
§ Undertake a study of
Māori lands
§ Implement the
updated MED strategy.
|
$68,843
|
Te
Whakaminenga
|
IR
team/ Economic Development team
|
February
– April 2020
|
2019/2020
MED Fund Repurposed by TWoK in April 2020 to assist with iwi COVID 19
response.
|
|
4. Heritage
|
Waahi Tapu
· Waahi Tapu bus tours
for iwi and community to enhance knowledge and understanding of the
significance of waahi tapu to iwi.
|
$2,118
|
Te
Whakaminenga
|
IR
team
|
End
of financial year
|
2019/2020
Fund Repurposed by TWoK in April 2020 to assist with iwi COVID 19 response
|
|
Maramataka
· Develop Maramataka
for 2020/21
|
$8,217
|
IR
team
|
IR
team
|
September-June
2020
|
Ngāti
Toa Rangatira project managed the development of the 2020/2021 Maramataka,
with assistance from IP team TRoNTR and TWoK Chair and approved for printing
June 2020.
|
|
· Launch of maramataka
· Promote to the
community in line with Matariki
|
$2,500
|
IR
team
|
IR
team
|
June-July
2020
|
Ngāti
Toa Rangatira to work collaboratively with IP Team and Council staff and
members to confirm a venue for a 10 July 2020 launch of the Maramataka
|
|
Heritage Trail
· Contributing to the
ongoing development of the Districts Heritage Trail which includes the
development of all information in te reo Māori
· Kāpiti Story
– telling the iwi story
· Collation/Cataloguing
of current info and further development of exhibition/history panels
|
$7,829
|
Te
Whakaminenga
|
IR
team in conjunction with cross council teams
|
End
of financial year
|
2019/2020
Fund Repurposed by TWoK April 2020 to assist with iwi COVID 19 Response
|
|
6. Waitangi Day
|
Implementation of
Community Commemoration
· Council and iwi to jointly
manage the districts approach to Waitangi Day with iwi
· Investigate
additional funding towards event.
|
$12,912
|
Corporate
Management
|
IR
team, Te Waka and across Council
|
February/
March 2020
|
Held
6 June 2020 at Campbell Park Paekākāriki in collaboration with
Pāekākāriki Community Board and community and Ngāti
Haumia /Ngāti Toa Rangatira
|
|
7. He Taonga te reo
|
Bi lingual signage
· Progress this
initiative in Ōtaki – Ōtaki educational signs
· Explore
opportunities to progress this through the wider Kāpiti Coast
· Rongōa signage
|
$2,384
|
Parks
and Open Spaces
|
IR
team and Alison Law
|
End
of financial year
|
Bilingual
Signage for Playgrounds
|
|
Te Reo Māori
Week
· Initiate activity to
celebrate Te Reo Māori Week across the community
· Develop strategies
to support Te Reo Māori throughout the year.
|
$5,000
|
Te
Whakaminenga
|
IR
team and across Council teams
|
July-September
2019
|
|
|
Matariki
· Applications by iwi
to fund projects that build knowledge and understand of Matariki in the community.
· Activity that will
be supported will be those events that promote Matariki to the wider
Kāpiti community of: What Matariki is? What is the Significance of
Matariki for Māori? How to incorporate Matariki into everyday life.
|
$9,001
|
Te
Whakaminenga
|
IR
team and across Council teams
|
November-June
2020
|
COVID
19 situation interfered with IP Team plans to request applications by iwi to
fund projects to promote and build knowledge of Matariki
|
|
Internal
· Create opportunities
to develop Te Reo me ona tikanga Māori for council staff.
· Support
opportunities to develop pronunciation of kupu Māori/Identity activities
that will promote Te Reo Māori week and other identified strategies
amongst the community.
· Establish
relationships with providers of te reo Māori classes
· Promote awareness of
te reo Māori providers and organisations to the Kāpiti community
· Establish
relationships with Māori businesses in the community
· Promote Māori
business to the Kāpiti community
· Historical overview
of tāngata whenua to the Kāpiti Coast
· Overview of
Māori world view
· ART confederation
– elected members, Te Waka and staff induction process on marae.
|
$5,084
|
Te
Waka
|
Anita
and across Council teams
|
End
of financial year
|
Under
Action
IP
team developing strategy to support internal capacity development for staff
|
|
8. Marae Grant and
Maintenance programme
|
Marae Capacity
Building
· Implementation of
the Marae Support policy
· Asset management registers
with marae – review these in line with the requirements of Building
Warrant of Fitness with the Building team and recommend amendments where
required to the OPUS reports.
· Capital works
projects – support for additional funding maybe sourced through the LTP
and Annual Plan process
· Protection and
preservation, health and safety, maintenance and management of marae
· Understanding the
role of marae within the community.
|
$55,960
|
Te
Whakaminenga
|
IR
Manager
|
July
2019 – Accountability Report due by 30 June 2020
|
Under
Action,
Raukawa
Marae Trustees were the 2019/2020 Grant recipient with Grant Paid in March
2020.
Accountability
report due by 30 June 2020.
|
|
9. Emergent Issues
|
Treaty Settlements
· Develop mechanisms
that promote communication between Iwi and Council
· At iwi invitation,
Council will be invited to attend negotiation meetings as observers to the
process
· Staff time
· KCDC
|
Staff
time
|
KCDC/
Te Whakaminenga
|
IR
Manager
|
Ongoing
|
|
|
Takutai Moana (Marine
and Coastal) Act 2011
· Keep abreast of
emergent issues
· Customary
implications for mandate
· Impacts of new iwi
and hapu groups applying to represent, engage with the Crown.
|
Staff
time
|
KCDC/
Te Whakaminenga
|
IR
Manager
|
Ongoing
|
|
|
Housing
Keep abreast of
housing issues
· Changes to housing
stock of Council
· Changes to housing
stock of Housing New Zealand
· Housing forum
· Compile a list of
Council housing stock.
|
Staff
time
|
KCDC/
Te Whakaminenga
|
IR
Manager
|
Ongoing
|
|
|
Promote housing
initiatives District Plan
· Papakainga housing
· Promote healthy
housing initiatives with whanau, hapu and iwi relationships
· Advocate and support
the development of an Open for Business tool kit for supporting Maori land
owners to implement papakainga
|
Staff
time
|
KCDC/
Te Whakaminenga
|
IR
Manager
|
Ongoing
|
|
|
Te Ture Whenua
Māori
· Review of the Act
– implications for iwi and Council
· Rates implications
for Māori owned land
· Rates reviewed.
|
Staff
time
|
KCDC/
Te Whakaminenga
|
IR
Manager
|
Ongoing
|
|
|
Long Term Plan and
Annual Plan
· Ensure that
tangatawhenua strategic direction embedded into these documents.
|
Staff
time
|
KCDC/
Te Whakaminenga
|
IR
Manager
|
Ongoing
|
|
|
Mana Whakahono
ā rohe
· Keep abreast of
emergent issues
· Develop, or support
the development of, process for this
· Facilitate workshops
with MfE and other relevant organisations for staff and iwi partners (via Te
Whakaminenga).
|
Staff
time
|
KCDC/
Te Whakaminenga
|
IR
Manager
|
Ongoing
|
|
7.3 Economic
Development Strategy
Author: Darryn
Grant, Economic Development Manager
Authoriser: James
Jefferson, Group Manager Place and Space
Purpose of Report
1 To
seek feedback on the draft Kāpiti Coast Economic
Development Strategy and Implementation Plan 2020.
Delegation
2 The
committee has the necessary delegation.
Background
3 The
Kāpiti Economic Development Strategy 2015-2018 was
approved by the Environment and Community Development Committee in December
2014. The strategy was developed in collaboration with iwi and the business
community and was endorsed by the Kāpiti Chamber
of Commerce in January 2015. The strategy identified four areas of focus over
the three period:
· Leadership &
Responsiveness,
· Open for Business
(Council),
· Building
Capability and
· Positioning Kāpiti.
4 In
late 2018, a decision was made to refresh the current Economic Development
Strategy. The refresh process commenced with a number of partner / stakeholder
workshops to understand key concerns / issues with the current strategy and
economic development activity in the district. Feedback from these initial and
subsequent workshops identified that the four existing focus areas were
generally well supported and remained relevant in the current environment. The
primary concerns identified in the workshops were in relation to the delivery
and leadership of economic development activities in the district.
5 In
addition to the existing Kāpiti Economic
Development Strategy there is also a separate Strategy for Maori Economic
Development and Wellbeing which was adopted in July 2013. The purpose of the
strategy was to set out how Council will support Maori Economic Development in
Kāpiti. As part of this process, discussions were
held with iwi representatives about a combined strategy moving forward, which
was generally supported by representatives.
6 In
order to ensure that there was general agreement about the key areas of focus
for the strategy, a plan on a page was developed to help easily share the key
information. This included the vision, pillars, aims and key actions. An
example of this is shown below, a final version of this document will be
developed based on the final approved strategy.
7 .
Issues and Options
Issues
Delivery and Leadership
8 As
mentioned above, there is an existing strategy for Maori Economic Development
and Well-being. As part of this process, discussions were held with iwi
representatives about a combined strategy moving forward, which was generally
supported by representatives as a preferred approach.
9 Two
key issues were raised early in the partner / stakeholder workshops as being of
significant concern, these were in relation to the delivery and leadership of
economic development activity in the district. A community led governance
arrangement had previously been approved and established however the structure
did not continue long term and as a result there is now no formal coordinated
approach to economic development activity in the district. There is also no
current role for iwi in the governance of economic development activity.
10 Currently
economic development activities in the Kāpiti are
primarily delivered by two organisations; the Council and Wellington NZ, the
economic development agency for the Wellington region. Activities delivered by
Council include the delivery of an annual targeted grant process to support
Maori economic development initiatives and / or Maori businesses. Wellington NZ
have also recently appointed a Maori Business Advisor and we are that there has
been engagement with local Maori businesses by the advisor.
11 While
there are a number of activities occurring there has been limited coordination
of activity and leveraging of skills and resources across the various
organisations. This has caused a high level of frustration and mistrust for
some members of the community and makes it difficult for groups to sustain
their activities.
12 In
developing the refreshed strategy, a number of steps are proposed to help
address the current situation and ensure a more coordinated and inclusive
approach to economic development activity. Firstly, the following vision has
been developed:
Through
partnership, support the growth of a vibrant, diverse Kapiti Coast economy that
provides increased opportunity, resilience and well-being for all.
13 The
vision was developed to recognise the need for a collaborative approach to
delivery of the strategy but also that there needs to be collective benefit
from the outcomes in the strategy in order to support long term growth.
Consideration needs to be given to all participants of the economy including
iwi, residents, business and visitors. The vision aligns with Council’s
vision of: thriving environment, vibrant economy, strong communities –
toitu Kapiti – the lifestyle choice.
14 In
addition, a specific Pou / Pillar has been proposed: Kotahitanga /
Strengthening partnerships and Leadership. A priority action is the
establishment of an independent Governance Board: Economic Development
Kotahitanga Board. In order for the strategy to be successful there needs to be
clear accountability, with a focus on:
· Independent
governance
· Clear
prioritisation
· Implementation
· Monitoring and
reporting
· Review and
adaption
15 Subject
to approval of the strategy, a separate Terms of Reference will be developed
for the Board, with key points for inclusion including:
· full iwi
representation
· the appointment of
an independent Chair and board members.
· appointment of
members based on capability and not representation
· ex-officio
representation of Council via a Council appointed elected representative
· Council to provide
officer and resource support to the board.
16 Initial
responsibilities for the board will include overseeing the implementation of
the strategy, advocating for the district and economic activities in the
district and being a relationship broker, with a focus on establishing and
strengthening strategic relationships to progress economic development
opportunities.
Focus Areas
17 The
following Pou / Pillars were identified as part of the strategy refresh:
· Whakapapa /
Positioning the Kapiti Coast
· Kaitiakitanga /
Open for Opportunity
· Whanau / Growing
skills and capability
· Kotahitanga /
Strengthen partnerships and Leadership
· Manaakitanga /
Supporting key sectors
18 Under
each of the Pou / Pillars, a Whāinga / Aim and Key Actions were identified
along with short and medium term outcomes. A number of key actions were
identified in each Pou with an implementation plan developed to help prioritise
delivery of actions and identify lead organisations and key partners.
19 The
following actions were identified as priority actions in year one of the
strategy:
· Deliver the Kāpiti Story
· Provide a
coordinated approach to the facilitation of key opportunities, such as the
attraction of new businesses and government agencies
· Develop a Kāpiti Coast Workforce Plan
· Establish an
Economic Development Kotahitanga Board and support the development and delivery
of a Covid 19 Recovery Plan
· Develop a Kāpiti Coast Destination Plan and a strategy for one
other key sector
· Finalise the
monitoring and reporting framework for the Economic Development Strategy.
Covid – 19 Pandemic
20 In
March this year, New Zealand was impacted by the Covid – 19 Pandemic,
which is causing significant health, economic, social and cultural issues
globally. In response to the pandemic, the New Zealand Government put in place
a number of lock down restrictions, with some of these still remaining in place
now, such as restricted international border access into New Zealand. Restrictions
included the closure of all non-essential services and businesses, which not
only effected the businesses directly but the workers in those organisations.
21 An
initial economic report on the impacts of Covid 10 has been received from
Infometrics and shows negative impacts across the district with reductions in
GDP and employment growth forecasted. Impacts are not consistent across sectors
or the workforce and initial forecasts indicate that sectors such hospitality,
tourism and retail will be impacted more than others. The report also shows
that a higher proportion of young people, Maori and low skilled workers are
forecasted to be impacted.
22 The
full impacts of Covid – 19 are not yet known and are unlikely to be fully
understood for some time. In order to support the recovery from impacts of the
pandemic, a separate recovery plan is to be developed for the district which
will include a work stream focused on economic recovery.
Outcomes and Impacts
23 In
order to measure the success of the strategy a number of medium and long term
outcomes have been included under each Pou / pillar. In addition to the
outcomes, four impacts have been proposed for measurement over the term of the
strategy:
· Employment Growth
– increase in local employment options and pathways
· Mean Income Growth
– increase in higher paying local employment and income generating
opportunities
· Business Unit
Growth – increase in businesses establishing, expanding and moving to the
district
· GDP Growth –
increased growth of the local economy and key sectors
24 Where
possible wellbeing outcomes have been taken into consideration however because
there is no consistent measure of economic wellbeing, more traditional measures
such as GDP growth have had to be utilised.
25 Given
the economic impacts of Covid 19, it is not considered appropriate to set
measures at the current point in time. As mentioned above the ongoing impacts
of Covid 19 are not yet fully known and control over many of these is outside
the influence of the actions in this strategy and linked more to the current
Macroeconomic environment.
26 Following
the establishment of the governance board, performance measures will be agreed
with the board. If there is still a significant level of uncertainty it is
proposed that a trend based approach is taken, with comparisons made against
other local and regional measures to see how the district’s economy is
tracking.
Strategy Format
27 A
copy of the draft Kāpiti Coast Economic
Development Strategy and Implementation Plan 2020-2023 is appended to this
paper. The strategy is in a draft layout while feedback is received.
28 As
part of the final design process it is proposed that a short and long form
version of the strategy are developed, with an accompanying one-page document
to also be completed (Plan on a Page).
Considerations
Policy
considerations
29 There
are no policy considerations at this stage of the strategy.
Legal
considerations
30 There
are no legal considerations at this stage of the strategy and the strategy is
not required to follow the special consultative procedures set out in the Local
Government Act.
Financial
considerations
31 The
implementation of the strategy in year one will be funded from the existing
Economic Development budget. This will require reprioritisation of the existing
budget allocations to ensure alignment with the final agreed actions identified
in the strategy.
32 Further
activities / projects arising from these and other actions in year two and
three will need to be considered as part of the Long Term Plan process.
Tāngata
whenua considerations
33 During
the development of the strategy there have been briefings with Te Whakaminenga
o Kapiti. In addition to these briefings, individual workshops were offered
with representatives of all three iwi, with sessions held with representative
of Ngati Toa Rangatira and Te Ati Awa ki Whakarongotai.
34 Partnership
has been a core principal through the development of the strategy and this is
also correct in the delivery of the strategy. In order to support this
partnership and following feedback from members of Te Whakaminenga o Kāpiti, representation is proposed for all three iwi on
the governance board.
Strategic
considerations
35 The
draft Kāpiti Coast Economic Development Strategy
and Implementation Plan 2020 has been developed in line with the 2018 –
38 Long Term Plan, with a focus on contributing to the development of a vibrant
Kapiti Coast economy.
|
Recommendations
36 That
Te Whakaminenga o Kāpiti endorse the draft Kāpiti Coast Economic Development Strategy and
Implementation Plan 2020, subject to feedback provided.
|
Appendices
1. Draft
Kāpiti Coast Economic Development Strategy and Implementation Plan 2020 ⇩
|
Te
Whakaminenga o Kāpiti Agenda
|
30 June 2020
|
Kapiti Coast Economic Development
Strategy and Implementation Plan 2020-2023
Draft Report
18
June 2020
|
Foreword 1
Executive
Summary 3
Introduction 10
Our
Economy and community 14
Strategic
Framework 20
Implementation
and Delivery 26
Governance
and Accountability 33
|
|
Appendix
1 : Our Economy 35
Appendix
2 : Definitions 47
|
tables
|
Table 1: Positioning the Kāpiti Coast – Key
Actions 27
Table 2: Open for Opportunity – Key Actions 28
Table 3: Growing Skills and Capability – Key Actions 29
Table 4: Strengthening Partnerships and Leadership –
Key Actions 30
Table 5: Supporting Key Sectors – Key Actions 32
Table 6: Year 1 – Priority Key Actions 34
|
figures
|
Figure 1: Our Strategic Pillars and Focus 6
Figure 2: Our Foundations for Success 11
Figure 3: Geography of the Kāpiti Coast 14
Figure 4: Population forecasts Kāpiti Coast 2013-2043 15
Figure 5: Ngā Pou 21
Figure 6: Kāpiti Coast Economic Development Strategy
– Strategic Framework 23
Figure 8: Proportion of GDP 2019 35
Figure 9: Wellington Region Creative Industries Employment 38
Figure 10: Domestic and International tourism expenditure 2019 40
Figure 11: Tourism spending growth 2010-2019 40
Figure 12: Age demographics Kāpiti Coast District compared
to New Zealand 2019 41
Figure 13: Unemployment rate, annual average 2018 and 2019 43
Figure 14: Percentage of school leavers with NCEA Level 2 or
above 2018 43
Figure 15: Percentage of Māori school leavers with NCEA
Level 2 or above 2018 44
Figure 16: Percentage of Māori school leavers with NCEA
Level 2 or above 2009-2018 44
Figure 17: Consumer spending 2016 - 2019 45
Figure 18: Rental affordability index 2000-2019 46
|
he wāhinga
kōrero Foreword
Nō mātou te maringa nui kia whakaputa atu tēnei mahere
rautaki, mahere whakamahinga. He mea whakawhanake tēnei nā ngā
iwi o te kotahitanga ki te tonga (ART), ngā hunga whaipānga me te
hāpori whānui. He kaupapa tāwharau tēnei i te koke whakamua
o te ōhanga puta noa i te hāpori o Kapiti. He hononga tōna ki te
mahere pae tawhiti (‘Long Term Plan’) o te Kaunihera o Kapiti, kia
kotahi mai ngā hāpori katoa o te rohe.
Mā te Poari Whakawhanake
Ōhanga Kotahitanga (Economic Development Kotahitanga Board) e whakahaere
te rautaki nei. Mā te mahi tahi e tautoko ai i te whakamahinga me te
tutukinga o ngā whainga matua. Me rite ka tika nā te nui o ngā
wero, ngā piki me ngā heke, hei tautoko i tō tātou
ōhanga me te hāpori mai i ngā wero pēnei i te Mate
Urutā (COVID19), aha atu, aha atu.
Ko te anga whakamua o te mahere rautaki nei hei whakakotahi
mai i te rohe whānui o Kapiti me ngā tari kāwana. Hei
tūāpapa mō te oranga tonutanga mō te hāpori
whānui mai Paekākāriki ki Ōtaki, mai i ngā maunga ki
te moana.
Te Whakaminenga o Kāpiti
I am pleased to present the Kāpiti Coast Economic
Development Strategy and Implementation Plan 2020-2023 that has been developed,
and will be delivered, in partnership with iwi, key partners, stakeholders, and
the community. The strategy has been developed with the overarching priority of
enhancing the economic wellbeing for all on the Kāpiti Coast. Our district
is alive with opportunity and the vision and outcomes of this strategy align to
that of our Long Term Plan, and focus on ‘building a stronger Kāpiti
Coast together’.
The implementation of this strategy will be overseen
by an Economic
Development Kotahitanga Board. This will be a collaborative governance model
which will not only support the delivery of our priority actions but will also
help ensure we can react to internal and external economic opportunities and
impacts, such as the Covid19 pandemic. We need to be able adapt to these
challenges and ensure that all participants in our economy are supported.
The next three years will see important and
significant changes, including the opening of major new transport
infrastructure, which will increase the attractiveness of the district to
visitors, new residents, and businesses. As a community we need to ensure we
can take advantage of this investment.
The approach outlined in the Strategy demonstrates the
importance of partnership and working together as a district along with other
regional and central government agencies to deliver on our proposed actions.
These provide firm foundations, enhancing our district and the economic
well-being of residents from Paekākāriki to Ōtaki, from the
beachfront to the hillside. We will tread carefully but deliberately, which
means taking specific, incremental steps that give us increased choices in the
future.
Mayor K Gurunathan
Introduction
As a district, the Kāpiti Coast is primed for
growth, significant new infrastructure is nearing completion, our population is
growing, and our attractiveness to the business and investment community is
only increasing. Opportunities for local partners to work together and for the
district to work more closely and strategically with our neighbouring regions
are happening and these collaborations are necessary to ensure better economic
outcomes and more inclusive growth.
This Economic Development Strategy and Implementation
Plan (the Strategy) provides a framework for growing the Kāpiti
Coast’s economy for the benefit of current and future residents, iwi,
communities and businesses. The Strategy covers the period 2020–2023 and
replaces the previous Kāpiti Coast Economic Development Strategy
2015-2018. The Strategy has been developed in kotahitanga / partnership and
will be delivered through kotahitanga / partnership. This will be fundamental
to our success and to building strong foundations and community well-being over
the next three years.
At this current moment, a key economic and well-being
concern for us all is the Covid-19 pandemic and how this will impact our
businesses and communities. The virus has already impacted many parts of our
economy, and it is expected that further impacts will emerge over time. A
separate recovery plan is being prepared for the district and this will be
guided by our longer-term aspirations, as well as the immediate impacts in our
community.
Wider strategic context
In developing this Strategy, we have also considered
the wider strategic context and the need for strong cooperation and commitment
at a national and regional level. This will be important to ensure effective
implementation and delivery and we will continue to pursue opportunities
associated with Central Government and other sources funding which can provide
much needed investment in the district as we continue to grow.
The Strategy’s objectives and actions also
recognise the importance of delivering inclusive and sustainable growth and we
are committed to enhancing the well-being of all our residents and communities
in the district.
Areas of opportunity
There are significant opportunities to further grow
and develop the Kāpiti Coast economy, including:
· increasing the awareness of the Kāpiti Coast as a
great place to live, visit and do business; highlighting our quality of life,
improved infrastructure, rich culture and resilience in order to attract more
residents, businesses and investment, and increase visitor spend and guest
nights
· enabling increased higher paying local job
opportunities in our communities, creating more employment and training
pathways for our young people / rangatahi including those not in education,
employment, or training (NEET’s), and facilitating opportunities for
industry to connect to the skills, talent and expertise of older people and
people with disabilities in the district.
· highlighting our key sectors and environment, including
what we have to offer in terms of manufacturing and service based industries,
creative industries, productive lands and niche & artisan producers,
attractions and parks, and working with iwi to unlock opportunities for
Māori-owned land and businesses.
· supporting and encouraging more businesses to start up
and establish in the district. Kapiti already has a high percentage of
self-employed residents, 27.9% compared to 16.2% nationally and the opportunity
exists to support further growth of these existing businesses, as well as
helping new businesses establish and feel welcomed.
Areas we need to improve
1.
There are also areas we need to
improve, including:
· continuing to develop and make the case for additional
efficient, effective, and resilient transport infrastructure across all of the
Kāpiti Coast and improving our connectivity to other centres
· developing, attracting, and retaining a skilled and
competitive workforce, based on an understanding of current and future
workforce needs, addressing skills gaps and shortages and facilitating greater
connections between businesses, education and training providers and our
communities
· improving community well-being including providing
pathways to higher income jobs and enabling local career progression, supporting
our young people / rangātahi with sustainable pathways to employment and
further training and encouraging entrepreneurship and innovation. Ensuring
older people and people with disabilities in our community have the opportunity
to contribute their skills and experience in a way that recognises the unique
contribution that they can bring as we continue to grow and adapt.
· placing greater focus on growing and supporting our
partnerships with iwi, business and the community and providing strong leadership
and transparency, strengthening communication between groups and building
trust.
· support for key sectors and having a better
understanding of their potential for
growth and how best to facilitate and support this in partnership with the
sector. Initial focuses would include sectors such as Tourism and Creative
Industries.
Ngā Moemoea / Our vision
As a community we have developed a strategic vision,
Ngā Moemoea, that is at the heart of this strategy and highlights the
importance of partnership in our approach and inclusive growth for all members
in our community.
Through partnership, support the growth of a vibrant,
diverse Kāpiti Coast economy that provides increased opportunity,
resilience, and well-being for all.
To achieve this vision, our partners, businesses, and
communities have told us that we need to work together to:
· Celebrate our rich culture and identity and highlight
the opportunities and advantages of the Kāpiti Coast and attract domestic and international visitors,
residents, and businesses to the district.
· Adopt a business-friendly focus that enables all participants in the economy to
operate to their full potential and contribute to a vibrant economy while
protecting our natural environment.
· Enable innovation, creativity and entrepreneurship by continuing to build connections and networks with
local talent and supporting sustainable pathways for our current and future
employment requirements, with increased Maori employment pathways and business
initiatives.
· Strengthen partnerships and leadership, providing increased opportunity for quality local
entrepreneurship, growth and collaboration, while celebrating, protecting, and
strengthening our unique and distinctive community.
· Focus our efforts to grow those industries and sectors
that provide the most potential for
the Kapiti Coast economy and our community.
Our strategic pillars
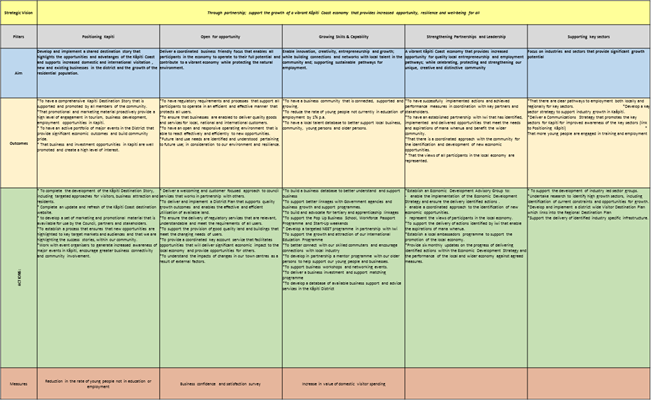
The above vision and priorities shape the five
pillars, Ngā Pou, of this strategy, which are illustrated below in Figure 1.
Figure
1: Our
Strategic Pillars and Focus
|
Ngā
Moemoea / Vision
|
Through partnership, support the growth
of a vibrant, diverse Kāpiti Coast economy
that provides increased opportunity,
resilience, and well-being for all
|
|
Ngā
Pou / Pillar
|
WHAKAPAPA / Positioning the Kāpiti
Coast
|
KAITIAKITANGA /
Open for opportunity
|
WHĀNAU /
Growing skills and capability
|
KOTAHITANGA / Strengthening partnerships
and Leadership
|
MANAAKITANGA /
Supporting key sectors
|
|
Ngā
Whāinga / Aim
|
Celebrate our rich culture and identity and highlight the opportunities and advantages of the
Kāpiti Coast
|
Facilitate quality growth
|
Enable employment, innovation, creativity and
entrepreneurship and improve capacity for mana whenua participation
|
Delivery and implementation through strengthened partnerships
and leadership and recognises the significant relationship with iwi as mana
whenua
|
Grow industries and sectors that provide the most
potential for supporting improved economic well-being
|
|
Ngā Mahi /
Actions
|
Develop and deliver the Kāpiti Coast Story
Facilitate and support major events
Build awareness of Kāpiti Coast’s
resiliency and our climate change focus
|
Ensure a welcoming and customer focused approach to
council services
Have a coordinated approach to the facilitation of
key opportunities
Ensure effective regulations that support growth and
protect our environment, including the District Plan
Attract new businesses and agencies to the
Kāpiti Coast
|
Develop a Workforce Plan including a Youth Initiative
and opportunities for Maori, older people and people with disabilities.
Facilitate growth of international education
Advocate for local tertiary and apprenticeship
linkages
Enhance business networking and training opportunities
Develop a business investment and support matching
programme
|
Establish an Economic Development Kotahitanga Board
and finalise the monitoring and reporting framework for the Strategy
Support the development and delivery of a Covid 19
recovery plan
Support actions that enable mana whenua aspirations
Advocate for new and improved essential
infrastructure including electrification of rail to Ōtaki
Support unique economic opportunities in our
communities
Advocate for increased access to affordable housing
to support the growth and retention of local residents
|
Identify opportunities and barriers
experienced by key sectors, including high growth sectors
Develop a district wide Destination Plan to support
the growth of the visitor economy, including strengthened air linkages and
supporting infrastructure such as the Kāpiti Gateway.
Support the development and delivery of a Kāpiti
Creative Industries Plan
Encourage the reduction of waste and emissions
Support development of industry led groups
|
|
Ngā whakaputa
nga takawaenga / Medium term outcomes
|
Increased awareness of the Kāpiti Coast as a
destination
Increase in number of attendees at major events
delivered
|
Businesses recognise Kapiti as a great place to
establish and grow
Key industries and businesses feel supported
More businesses and organisations actively
considering the Kāpiti Coast
|
Improved match between workforce needs and skills
available
Increase in employment and training pathways for
young people and Maori
Increased business networking and awareness of
training and support
|
Increased business engagement
Increased advocacy for Kāpiti Coast
Increase in Government investment into district
|
Targeted actions to support growth of key industries
Growth of visitor economy
Improved resilience and climate awareness across key
industries and businesses
Industry led business groups established
|
|
Ngā whakaputa
nga roroa / Longer term outcomes
|
Increase in visitor numbers and expenditure
Increase in new businesses establishing in district
|
Growth of key industries and businesses
Economic impacts and opportunities of key projects
understood and realised Relocation
of Government Offices to Kāpiti Coast (combined 200+ FTE)
|
Increase level of qualification attainment
Decrease in proportion of NEETs
Decreased rates of unemployment
Increase in investment into key industries and
businesses
|
Increased infrastructure investment in Kāpiti
Coast
Manu whenua aspirations realised
|
Growth of key industries and businesses
Reduction in emissions and increased climate
resilience
Sustainable multi-sector partnership and
collaboration
|
|
Impacts
|
Employment Growth – increase in local
employment options and pathways
|
Mean Income Growth – increase in higher paying
local employment and income generating opportunities
|
Business Unit Growth – increase in businesses
establishing, expanding and moving to the district
|
GDP Growth – increased growth of the local
economy and key sectors.
|
|
|
|
|
|
|
|
|
|
Governance
and delivery
2.
The ongoing arrangements for governance
and delivery of this strategy are as important as the proposed actions. This
governance needs to be consistent, continuous, and effective.
3.
Recognising this, it is agreed
that:
· the Economic Development Kotahitanga Board is
established
· an independent chair is appointed by Council to build
trust, pull together a strong board and provide a unified strategic direction
· the board will be selected based on capability and
board members need to be able to work productively with multiple partners and stakeholders
within and outside the district
· a council representative will be an ex-officio member
of the board
· local iwi will be fully represented on the board
· council will provide support to the board.
· A separate Terms of Reference Agreement will be
developed and agreed with the Board.
4.
It is proposed that the initial
core responsibilities of the Board would focus on overseeing the Economic
Development Strategy and Implementation Plan, advocating for Kāpiti Coast
and for economic development activities in the district, and being a
relationship broker, with a focus on the establishment of strategic
relationships to progress economic development opportunities. The Board will also play an important role
in finalising and agreeing the monitoring and reporting framework for the
Strategy. This recognises that given the Covid-19 pandemic, there is a need to
understand more fully the economic impacts on the local economy and how these
will effect our economic performance and growth.
Priorities for year 1
5.
The implementation plan contains a
significant number of actions that will be progressed by the Board, Council and
its key partners over the coming years. In year 1 our priorities are to:
· Deliver the Kāpiti Story – which supports our positioning the Kāpiti Coast
pillar.
· Provide a coordinated approach to the facilitation of
key opportunities, such as the attraction of new businesses and government
agencies. – which supports our
open for opportunity pillar.
· Develop a Kāpiti Coast Workforce Plan– which supports our growing skills and
capability pillar.
· Establish an Economic Development Kotahitanga Board and support the development and delivery of
a Covid 19 Recovery Plan – which supports our strengthening
partnerships and leadership pillar and recognises the significant relationship with iwi as mana whenua.
· Develop a Kāpiti Coast Destination Plan, which
includes a focus on increasing opportunities for Maori business and a strategy
for one other key sector – which
supports our supporting key sectors pillar.
· Finalise
the monitoring and reporting framework for the Economic Development Strategy -
which will be agreed with the Board after the Covid 19 impacts are better
understood and will provide a framework for ongoing performance measurement
Purpose
of this strategy
The purpose of Economic
Development Strategy and Implementation Plan 2020-2023 (the Strategy) is to
provide a framework for growing and developing the Kāpiti Coast’s
economy for the benefit of current
and future residents, iwi, community, and business.
The objectives, actions and priorities proposed in the
Strategy are based upon:
· engagement and discussion with iwi, other partners,
and wider stakeholders to understand their perspectives and priorities for the
future of the Kāpiti Coast’s
economy
· an understanding of the strategic and policy context,
at a local, regional, and national level, and consideration of what these
mean for the Kāpiti Coast
· analysis of the Kāpiti Coast’s economy and
well-being, as well as an initial understanding of the impact of the current
Covid-19 pandemic.
The Kapiti Coast is primed for growth, with
significant new infrastructure being developed, and new amenities such as the
Te Raukura ki Kāpiti (Kāpiti Coast Performing Arts Centre), recently
completed. Our district has a lot to offer to new residents, businesses and
visitors and the district provides significant opportunity to support the
growth of a more resilient Wellington region.
Like all districts, there are also issues and
challenges that we need to address, while our infrastructure is improving there
is also a need to plan for the future and to consider what else is required to
make our existing industries and communities more attractive and
resilient. To continue to support quality growth we need to better
understand these opportunities and ensure these don’t impact our future
potential.
We need to understand our key sectors, and emerging
opportunities, to strategically plan to enable sustainable growth. We need to
support our existing business and enable new businesses to grow. We also need
to attract more visitors, more talent, and more investment. We need to nurture
entrepreneurship and innovation and grow the skills and capability of our
industries. Critically, we also need to support our rangatahi/young people into
sustainable pathways to employment and leadership, particularly those not
currently in Employment, Education or Training (NEETs).
Our district, like others across the region and
nationally, faces the unprecedented challenge of responding to and recovering
from the Covid-19 pandemic. Understanding the ongoing and longer-term impacts
of the pandemic will be a priority for our businesses and community alike and
the District will prepare a recovery plan which will sit alongside this
Strategy.
Despite the immediate impacts and uncertainties
created by Covid-19, over the longer term, the Kāpiti Coast’s
economy is well positioned to grow and prosper, with opportunities for partners
to work together and for the district to work more closely and strategically
with our neighbouring regions. This collaboration will enable better economic
outcomes and more inclusive growth, benefiting our residents, communities, and
businesses.
These issues set the context for this Strategy which
replaces our 2015-2018 Economic Development Strategy and provides the framework
for the development of the Kāpiti Coast economy. A strong inclusive
economy means more opportunity and greater well-being for all and allows
individuals, whanau, and communities the freedom to pursue their own
prosperity.
In this Strategy, we set out an implementation plan
with clear actions that have been developed with iwi, other partners, wider
stakeholders, and the community. These actions will be delivered through
partnership. This partnership will be fundamental to our success and to
building strong foundations with our communities across each of the
wellbeing’s over the next three years (Figure 2).
Figure 2: Our
Foundations for Success
7.
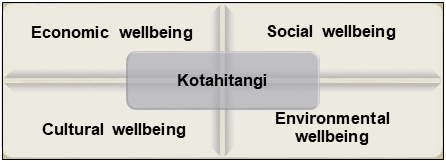
Wider
strategic context
In developing the strategy, we needed to consider the
wider strategic context for the district, which reinforces the requirement for
strong cooperation and commitment at a national and regional level. The
Wellington Regional Strategy (WRS), developed in 2007 and refreshed in 2012,
sets out a regional approach to support economic development and focuses on six
areas:
· commercialisation of innovation
· investment mechanisms for growth
· building world-class infrastructure
· attracting business, investment, and talent to the
region
· education and workforce development to service
regional economy needs
· being open for business.
The Wellington Regional Economic Development Agency,
WellingtonNZ, is tasked with progressing these areas and are committed to supporting
the implementation of this Strategy. Alongside the WRS, the Wellington Regional
Investment Plan and the Wellington Regional Growth Framework (currently being
prepared) have been developed in response to government’s request to have
a joined up approach on key issues such as housing, transport and supporting
the growth of business support in the region. The Wellington Regional Growth
Framework will provide a 30 to 100-year spatial plan for the region, alignment
with these will be important if we are to ensure the best possible partnership
with central government as a region including the Horowhenua District.
WellingtonNZ has also recently completed the
development of a Wellington Regional Workforce Plan and Government is currently
developing a National Workforce Leadership Group. To ensure that we can best
leverage these initiatives we will be developing a Workforce Plan for the Kāpiti Coast as one of the key priority actions of
this Strategy.
Greater Wellington Regional Council’s Māori
Economic Development Plan is also under development and is planned to be
launched in 2020. Council has discussed with iwi the continuation of a separate
Māori Economic Development Plan for the Kāpiti Coast or to be a
partner to this Strategy, or both. Iwi have indicated that being a partner in
this Economic Development Strategy and Implementation Plan was their preferred
choice and provided the best opportunity for a joined-up approach to realising
the potential of our current and future economy.
At a national level, we have seen a concerted focus
since early 2018 on unlocking productivity potential in the regions under the
Government’s Provincial Growth Fund (PGF). Kāpiti Coast was
announced as being eligible for the PGF in 2018 and the fund has already supported
projects in the district. More applications are being progressed and this
opportunity is likely to evolve as Government responds to Covid 19.
The Government’s focus on well-being brings an
inclusive growth focus to issues facing the country such as the housing shortage
and climate change. Well-being is crucial to sustainable long term economic
development and is a priority for the development and delivery of our
strategy.
Introducing
this strategy
The following sections of this strategy and
implementation plan set out:
· an overview of the Kāpiti Coast’s economy
and community, together with an assessment of the key opportunities and challenges
facing the district
· a strategic framework for the strategy which sets out
our vision and identifies our key strategic pillars, Ngā Pou, and
associated actions
· a detailed implementation plan, which identifies the
priority actions, lead agencies, key partners, and delivery timelines
· our arrangements for governance, monitoring and
accountability.
In addition, Appendix 1 provides a more detailed
assessment of the Kāpiti Coast economy and Appendix 2 provides definitions
of key terms contained in the strategy and implementation plan.
Our Economy and community
People
and place
We are a diverse, proud community - We are the
Kāpiti Coast.
9.
The Kāpiti
Coast District extends from Paekākāriki on the southern border
through to Ōtaki, and includes Kāpiti Island / Ko te Waewae Kapiti o Tara Raua ko Rangitane, a nationally important nature reserve (Figure 3)
Figure 3: Geography
of the Kāpiti Coast
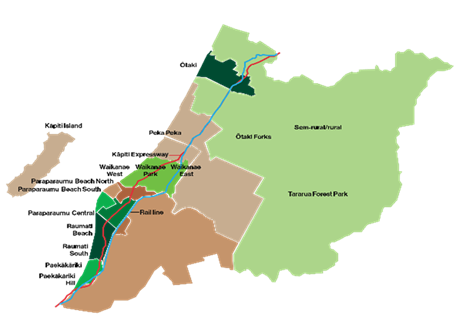
10.
11.
12.
The mana whenua – the people
with ‘authority and guardianship’ over the land’ – on
the Kāpiti Coast are Te Āti Awa ki Whakarongotai, Ngāti Raukawa
ki te Tonga and Ngāti Toa Rangatira. The Kāpiti Coast District
Council works in partnership with these three iwi under a longstanding
Memorandum of Partnership known as Te Whakaminenga o Kāpiti. We also
recognise that some Māori on this land identify with iwi outside the rohe
of the Kāpiti Coast.
Te Whakaminenga o Kāpiti
first met on 8 March 1994 and stems from two core principles of the Treaty of
Waitangi. The first principle, ‘partnership’, obliges both parties
‘to act reasonably, honourably and in good faith’. For that,
consultation is vital. The second principle, ‘active protection’,
requires the Crown to protect Māori in the use of their lands and waters
to the fullest extent practicable.
Our population is growing,
2,500 people joined our community in 2019 alone, an increase of 1.3% on our
2018 population. At least 56,000 people will call the Kāpiti Coast District
home in 2020, and this number is projected to continue growing as people are
attracted into the district.
13.
Forecasts from 2015 estimate that
our population will reach 68,548 by 2043 (Figure 4). This is an increase
of just under 1% growth per annum. Other districts such as Tauranga and Selwyn
have experienced population surges, and there is the strong potential for our
area to experience these same levels of growth. Any growth, if supported to be
sustainable, provides opportunities for increasing our workforce, our talent
pool, and growing our economy.
Figure 4: Population
forecasts Kāpiti Coast 2013-2043
14.
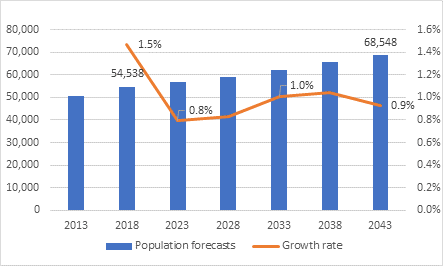
1 Source:
idcommunity (https://forecast.idnz.co.nz/kapiti)
15.
Our population is the second
oldest in New Zealand, with 27% of us aged 65 or older, up from 24% in 2009.
(Nationally this portion is 16%). Our working age population (15-64 years) is
10% smaller than the national average, and we also have a lower percentage of
young people (0-14 years old) than the national average.
16.
Our average household size is
smaller than the Wellington Region and for the rest of New Zealand. Almost
30% of us live alone, while around 65% live in one family households.
17.
We are within easy reach of the
capital city, meaning a high proportion (46%) of our residents travel daily for
work outside our district. We have pockets of wealth and pockets of
deprivation. On the New Zealand Deprivation Index (NZ DEP), Ōtaki
ranks as significantly deprived while most of the semi-rural and rural areas in
Kāpiti Coast are some of the least deprived in
New Zealand.
Economy and
industries
18.
Alongside the strategic and
demographic context set out in above, it is also important to understand the
Kāpiti Coast economy. Appendix 1 provides a high-level overview of the
economy and in the following section we provide a summary of:
· GDP and employment
· our key industries
· wellbeing.
GDP and
employment
In
2019, GDP for the Kāpiti District was almost $2 billion (2019 prices). On
average economic growth has been increasing steadily over the past 10 years at
2.4% p.a., in line with national growth of 2.5% p.a. However, the districts
economy is predicted to contract by 7% over the year to March 2021 as a result
of Covid 19 impacts.
Employment
figures were also positive in 2019 and our labour market was tight. A total of
17,693 people were employed in the Kāpiti Coast District in 2019. In the
same year, our unemployment rate was 3.4% (compared to the national rate of
4.1%).
Self-employment in the district is high. A total of
27.9% of workers were self-employed in the Kāpiti Coast District in 2019,
much higher than the national rate of 16.2%.
19.
However, as a consequence of the
impacts of Covid-19, employment growth is predicted to become negative 9.2% by
March 2021, with over 1,600 jobs expected to be lost in the district and those
in lower skilled jobs taking the largest hit (700). Despite this the unemployment
rate is predicted to be less than the national rate (8.3% compared to 9%), and
once recovery begins it is anticipated that there will be opportunities for
workers who have lost their jobs to be redeployed.
20.
A key priority of our strategy is
to develop a Workforce Plan and to understand current and future workforce
needs and the nature of the skills gap, this will help to inform the type of
training and / or tertiary provider we need to attract to our District.
21.
Achieving, and then maintaining
educational parity between Māori and non-Māori is important, to
ensure that young Māori have the skills and support to get well-paid
sustainable employment and be leaders in industry and the community.
22.
In 2018, 85% of Māori school
leavers on the Kāpiti Coast left school with an NCEA Level 2 or above
qualification. This percentage is much greater than the national average of 59%
for Māori. However, Māori school leaver educational attainment on the
Kāpiti Coast remains below the non-Māori result.
23.
Initial estimates have indicated
that young people and Māori are likely to be disproportionally impacted by
the economic impacts of Covid 19 and support will be needed to ensure that this
does not result in long term unemployment for these parts of our community.
Our key
industries
A key
set of industries continue to contribute to economic and employment growth in
the district. These include:
· Health care and social assistance – the biggest contributor to growth over the
past decade, worth 10.2% of the districts GDP in 2019 and accountable for 14.4%
of all filled jobs in the district. The strength of the industry is in part due
to our elderly and aging population which has increased the demand for aged
care services. While a small number of jobs (23, a reduction of 0.9%) are predicted
to be lost because of Covid 19, the industry’s strength will remain with
GDP forecast to increase by $0.61 million (or 0.3%) over the next year.
· Rental, hiring and real estate services – was worth 9.8% of the districts GDP in 2019,
and employed 12.1% of those employed in 2019. Our district has become
increasingly attractive and the growing housing market contributes to the
strength of this industry. A decrease of activity is expected for this industry
over the next year, with industry GDP falling by $5.7 million (2.9%) but
activity is likely to recover in the medium to long term.
· Professional, scientific and technical services – this was the second biggest contributor to
economic growth over the past decade. In 2019 the industry contributed 9.8% to
local GDP and accounted for 9.3% of filled jobs in the district. In 2019, 19%
of those who were self-employed worked in this industry. Covid-19 will impact
this industry in the short term, with 140 jobs losses (a reduction of 8.3%)
predicted, with a reduction of $12.6 million in GDP (or 6.3%) by March 2021.
· Construction
– as a steady employer in the area, construction accounted for 15.9% of
total filled jobs in 2019, and 9.1% of GDP. In 2019, almost a quarter of those
who were self-employed worked in this industry. Construction activity is
expected to decline in the short term, experiencing a reduction in GDP by 10.5%
(the largest in the district), but will likely grow steadily between 2022-2025
and is a key response focus for government.
· Manufacturing
– is a big contributor to GDP, worth 9.1% of total GDP in 2019, but
employs a smaller portion of the local workforce, accounting for 6.1% of filled
jobs in 2019. By 2021 only a small number of jobs will be lost in the industry,
but GDP is expected to fall by 5%.
· Retail trade
– is significant as an employer, accounting for 12.1% of total filled
jobs in 2019, but is less of a contributor to GDP, worth 6.4% of total GDP in
2019. By 2021 around 250 jobs will likely be lost due to Covid-19 (a reduction
of 12%) and GDP is expected to fall by $10 million (or 7.7%).
· Education and training - education on the Kāpiti Coast is reputable,
strong, and growing. The industry made up 4.4% of GDP and accounted for 8.8% of
total filled jobs in 2019. Covid 19 is expected to increase the demand for
education and training as workers reskill themselves for the future with
government announcing a number of schemes including apprenticeships to help
address significant unemployment. Access to tertiary education courses has been
impacted by the closure of the Whiteirea facility
· Tourism -
tourism GDP was $98.2 million, or the equivalent of 4.9% of the districts GDP
in 2019. The accommodation and food services industry which contributes to
tourism GDP is a big employer in the region accounting for 7.5% of filled jobs
in 2019. In 2020 tourism has experienced significant reductions in activity due
to Covid-19 however domestic visitor activity is predicted to help revive the
industry as restrictions allow. The district only has a small reliance on
international tourism and as a result has not seen the same level of impacts as
regions like Queenstown or Rotorua
· Creative Industries – the district is recognised as a creative area, with 4.2% of the
local workforce employed in the sector, and the fourth highest concentration of
creative jobs nationally, in 2019. However, Covid-19 is likely to have a severe
impact on most of this sector and efforts to revive jobs in the sector will be
needed.
24.
While recent economic performance
has been good for many sectors, unfortunately as shown above, Covid-19 will
likely reverse growth trends across most industries, with the full impacts not
yet known. This will also impact incomes in the district either through wage
reductions or job losses. As of 2019, mean annual earnings (a source of
household income) for the Kāpiti Coast was $48,805, which is already
significantly less than the national average of $63,000. More details are
provided in Appendix 1.
Well-being
25.
Sustainable economic growth is an
important contributor, but many factors determine people’s wellbeing such
as housing affordability, household income and mental health. Just because a
district or country is doing well economically does not mean all its people
are. We want all of our community to have the ability to share in the benefits
of a strong and growing economy. Making the best choices for current and future
generations requires working together to look beyond economic growth on its own
and consider social, environmental, and cultural implications.
26.
While there is still no single and
universally accepted definition or measurement of well-being there are a few
clear areas where action is needed if we are to improve the well-being and
quality of life of all our communities, including:
· Jobs and earnings – the Kāpiti Coast has a higher proportion of workers in
industries that are forecast to decline, leaving these workers more vulnerable
if these job losses do occur.
· Skills –
the Kāpiti Coast has a lower proportion of workers who are classified as
highly-skilled, reducing the potential for wage growth and higher paying jobs.
· Young people Not in Education, Employment or Training
(NEET) – the district
historically has a higher NEET rate than other parts of the country, making
pathways to employment more difficult and making it harder for employers to
maintain existing workforce levels in the future.
· Income and consumption – on average our householders have lower
household income figures, driven by a lower personal earning potential than
experience in other parts of the country and resulting in reduced local
consumption and increased pressures on housing and rental affordability.
Areas of opportunity
There are significant opportunities to further grow
and develop the Kāpiti Coast economy, including:
· increasing the awareness of the Kāpiti Coast as a
great place to live, visit and do business; highlighting our quality of life,
improved infrastructure, rich culture and resilience in order to attract more
residents, businesses and investment, and increase visitor spend and guest
nights
· enabling increased higher paying local job
opportunities for our communities, creating more employment and training
pathways for our young people / rangatahi including those not in education,
employment, or training (NEET’s), and facilitating opportunities for
industry to connect to the skills, talent and expertise of older people and
people with disabilities in the district.
· highlighting our key sectors and environment,
including what we have to offer in terms of manufacturing and service based
industries, creative industries, productive lands and niche & artisan
producers, attractions and parks, and working with iwi to unlock opportunities
for Māori-owned land and businesses.
· supporting and encouraging more businesses to start up
and establish in the district. Kapiti already has a high percentage of
self-employed residents, 27.9% compared to 16.2% nationally and the opportunity
exists to support further growth of these existing businesses, as well as
helping new businesses establish and feel welcomed.
Areas we need to improve
27.
There are also areas we need to
improve, including:
· continuing to develop and make the case for additional
efficient, effective, and resilient transport infrastructure across all of the
Kāpiti Coast and improving our connectivity to other centres
· developing, attracting, and retaining a skilled and
competitive workforce, based on an understanding of current and future
workforce needs, addressing skills gaps and shortages and facilitating greater
connections between businesses, education and training providers and our
communities
· improving community well-being including providing
pathways to higher income jobs and enabling local career progression,
supporting our young people / rangātahi with sustainable pathways to
employment and further training and encouraging entrepreneurship and
innovation. Ensuring older people and people with disabilities in our community
have the opportunity to contribute their skills and experience in a way that
recognises the unique contribution that they can bring as we continue to grow
and adapt.
· placing greater focus on growing and supporting our
partnerships with iwi, business and the community and providing strong
leadership and transparency, strengthening communication between groups and
building trust.
· support for key sectors and having a better
understanding of their potential for
growth and how best to facilitate and support this in partnership with the sector.
Initial focuses would include sectors such as Tourism and Creative Industries.
Priorities for action
28.
In order to take advantage of
these opportunities and ensure we can make improvements where required there
are a number of actions we need to take, key priorities include:
· Addressing the skills gap – skills gaps are impacting all industries and
highly skilled people being the most competitively sort after. We need to
understand our current skills gap and the type of skills we will need in our
workforce and key sectors will need in the future.
· Supporting our rangatahi/young people – our young people are an important asset and
we need to create sustainable pathways to employment and further
training. Historically we have a relatively high proportion of young
people not in Education, Employment or Training (NEET) and large proportion of
the youth population leave Kāpiti Coast for education and employment
opportunities in larger centres. We need greater diversity with employment
opportunities for youth and greater connectivity to local businesses.
· Creating greater connections for older people and
people with disabilities into our economy – connecting older people and people with disabilities to local
businesses and key industries and creating more opportunity to share their
skills, experience and connections to support new and growing businesses,
entrepreneurs and workers.
· Growing higher Incomes – a high percentage of our workers are in low
income jobs compared to the rest of New Zealand (retail trade, health care,
social assistance, education, training, accommodation, food services). A
greater proportion of households are in the low and medium income groups.
· Attracting and utilising talent and skills – a total of 46% of workers live in Kāpiti
Coast but work outside the district, with 25% working in Wellington City where
their earning potential is currently often greater. Growing more highly skilled
local jobs is important as this large commuting workforce provides significant
unutilised potential that is not benefiting the local economy and resulting in
extended periods away from family and community which impacts overall
wellbeing.
· Developing better amenities and services– while there have been
improvements in our infrastructure, the district still has limited amenities
compared to other regions (e.g. no tertiary education facilities compared to
Wellington and Palmerston North; no hospital; no rail transport north of
Waikanae, infrequent bus services).
· Placing
greater focus on growing and supporting our partnerships and providing strong
leadership – these issues need a collective response, this means
providing leadership and transparency, strong communication, building trust and
partnerships to deliver our Strategy.
Ngā Moemoea / Our vision
The above context and supporting analysis, has
informed our vision for this Economic Development Strategy and Implementation
Plan. As a community we have developed a strategic vision, Ngā Moemoea,
that is at the heart of this Strategy.
Through partnership, support the growth of a vibrant,
diverse Kāpiti Coast economy that provides increased opportunity,
resilience, and well-being for all.
To achieve this vision, our partners, businesses, and
communities have identified the need to work together to:
· Celebrate our rich culture and identity and highlight
the opportunities and advantages of the Kāpiti Coast and attract domestic and international visitors,
residents, and businesses to the district.
· Adopt a business-friendly focus that enables all participants in the economy to
operate to their full potential and contribute to a vibrant economy while
protecting our natural environment.
· Enable innovation, creativity and entrepreneurship by continuing to build connections and networks with
local talent and supporting sustainable pathways for our current and future
employment requirements, with a focus on Maori employment pathways and business
initiatives.
· Strengthen partnerships and leadership, providing increased opportunity for quality local
entrepreneurship, growth and collaboration, while celebrating, protecting, and
strengthening our unique and distinctive community.
· Focus our efforts to grow those industries and sectors
that provide the most potential for
the Kapiti Coast economy and our community.
Action in each of these areas will be essential if we
are to deliver our vision and enhance our economy. The benefits of an enhanced
economy extend well beyond the direct financial benefits.
The bigger picture includes higher living standards,
affordable housing, a sustainable environment and workforce and a district with
access to services and amenities that support and improve our
communities’ health and well-being; delivered through greater social
amenity and more choices for local residents.
By working together on these areas, we can expect to
see a range of benefits, which could include:
· Attracting new businesses, and growing key existing
sectors, will attract talent and new residents, develop our workforce skills,
grow jobs, and generate increased higher income opportunities. This means there
are more employment opportunities for residents which reduces the need to
commute, as well as greater spend in our local economy enhancing wellbeing.
· Growing and promoting Kāpiti Coast as a
destination, means that new businesses and visitors will have a positive knock
on effect to our economic wellbeing through household income, local jobs,
visitor spend, local services and amenities.
· More generally, the visitor economy allows Kāpiti
Coast to maintain a larger economic footprint than the population could support
by expanding the scale and range of commercial activities that can be
sustained. This creates more choices for residents, for example, the food
and beverage offering in Kāpiti Coast would be greatly reduced in the
absence of the visitor economy.
· Supporting our youth / rangatahi population which not
only offers a sustainable workforce opportunity for Kāpiti Coast but an
opportunity to grow and support young innovators and entrepreneurs. This means
Kāpiti Coast programmes such as Work Ready Kāpiti, Zeal, Startup
Weekend (linked to Techweek), The Māoriland Hub and Pop Up Business School
provide our rangatahi / young people with support, greater choice,
opportunities and stepping stones to a bright future.
· Working in partnership with our community to shape our
district’s economy and environment. This means a more holistic and joined
up approach to enhancing our wellbeing, environment and growing the Kāpiti Coast. Kāpiti Coast District Council
is already the leading Council in NZ for sustainability and climate change, we
reduced our footprint by 76% and will continue working to reduce this further.
This means we will work with Manu Whenua, our community, and businesses to
encourage best practice and continue to improve.
Our strategic pillars
The above priorities and vision, shape the five
pillars, Ngā Pou, of this Strategy, and
emphasise the need for the delivery of the Strategy in partnership and the
importance of ensuring that all parts of our district can benefit from our
actions over the next three years and beyond (Figure 5).
Figure
5: Ngā
Pou
|
Whakapapa
|
Kaitiakitanga
|
Whānau
|
Kotahitanga
|
Manaakitanga
|
|
Positioning the Kāpiti Coast
|
Open for Opportunity
|
Growing Skills and Capability
|
Strengthening Partnerships and
Leaderships
|
Supporting Key Sectors
|
Looking at the objectives of each of these strategic
pillars:
· Whakapapa / Positioning the Kāpiti Coast – focuses on the actions required to enhance the
visibility and attractiveness of the Kāpiti Coast as a destination.
· Kaitiakitanga / Open for opportunity – focuses on the actions that will make the district
more responsive and open to quality growth.
· Whānau
/ Growing skills and capability –
focuses on the actions that support workforce development, creativity,
entrepreneurship and sustainability.
· Kotahitanga
/ Strengthening partnerships and leadership – focuses on the actions that will ensure we have
robust mechanisms for working together at both a local and regional level.
· Manaakitanga
/ Supporting key sectors –
focuses on actions that support the growth of key sectors and industries.
Under each of these pillars we have identified key
actions which will be critical to delivering our objectives and overall vision
(Figure 6). For each pillar we have indicated the medium-term outcomes which we
will be reported and monitor against over the next three years. We have also
identified longer-term outcomes, which we expect to see improvements against
over the next five years, while there is a connection between the medium and
longer term outcomes, progress against the longer term outcomes will also be
influenced by other external factors.
Finally, we have
also identified impacts that align with the priorities of the Strategy and our
vision for the Kapiti Coast's economy, progress against these impact indicators
will largely be outside of our control but they will be important indicators to
measure progress against and to ensure that the actions we are taking are
contributing to growing our local economy for the benefit of all our community.
Our overall approach to measuring outcomes and impacts recognises that, given
the implications of Covid-19, the Kapiti Coast needs to ensure that it
continues to maintain or improve its performance against national and regional
averages and those of our neighbouring districts.
Figure 6: Kāpiti Coast Economic Development Strategy – Strategic
Framework
|
Ngā Moemoea /
Vision
|
Through partnership, support the growth
of a vibrant, diverse Kāpiti Coast economy
that provides increased opportunity, resilience,
and well-being for all
|
|
Ngā Pou / Pillar
|
WHAKAPAPA / Positioning the Kāpiti
Coast
|
KAITIAKITANGA /
Open for opportunity
|
WHĀNAU /
Growing skills and capability
|
KOTAHITANGA / Strengthening partnerships
and Leadership
|
MANAAKITANGA /
Supporting key sectors
|
|
Ngā
Whāinga / Aim
|
Celebrate our rich culture and identity and highlight the opportunities and advantages of the
Kāpiti Coast
|
Facilitate quality growth
|
Enable employment, innovation, creativity and
entrepreneurship and improve capacity for mana whenua participation
|
Delivery and implementation through strengthened
partnerships and leadership and recognises the significant relationship with
iwi as mana whenua
|
Grow industries and sectors that provide the most
potential for supporting improved economic wellbeing
|
|
Ngā Mahi / Actions
|
Develop and deliver the Kāpiti Coast Story
Facilitate and support major events
Build awareness of Kāpiti Coast’s
resiliency and our climate change focus
|
Ensure a welcoming and customer focused approach to
council services
Have a coordinated approach to the facilitation of
key opportunities
Ensure effective regulations that support growth and
protect our environment, including the District Plan
Attract new businesses and agencies to the
Kāpiti Coast
|
Develop a Workforce Plan including a Youth Initiative
and opportunities for Maori, older people and people with disabilities.
Facilitate growth of international education
Advocate for local tertiary and apprenticeship
linkages
Enhance business networking and training
opportunities
Develop a business investment and support matching
programme
|
Establish an Economic Development Kotahitanga Board
and finalise the monitoring and reporting framework for the Strategy
Support the development and delivery of a Covid 19
recovery plan
Support actions that enable mana whenua aspirations
Advocate for new and improved essential
infrastructure including electrification of rail to Ōtaki
Support unique economic opportunities in our
communities
Advocate for increased access to affordable housing
to support the growth and retention of local residents
|
Identify opportunities and barriers
experienced by key sectors, including high growth sectors
Develop a district wide Destination Plan to support
the growth of the visitor economy, including strengthened air linkages and
supporting infrastructure such as the Kāpiti Gateway.
Support the development and delivery of a Kāpiti
Creative Industries Plan
Encourage the reduction of waste and emissions
Support development of industry led groups
|
|
Ngā whakaputa
nga takawaenga / Medium term outcomes
|
Increased awareness of the Kāpiti Coast as a
destination
Increase in number of attendees at major events delivered
|
Businesses recognise Kapiti as a great place to
establish and grow
Key industries and businesses feel supported
More businesses and organisations actively
considering the Kāpiti Coast
|
Improved match between workforce needs and skills
available
Increase in employment and training pathways for
young people and Maori
Increased business networking and awareness of
training and support
|
Increased business engagement
Increased advocacy for Kāpiti Coast
Increase in Government investment into district
|
Targeted actions to support growth of key industries
Growth of visitor economy
Improved resilience and climate awareness across key
industries and businesses
Industry led business groups established
|
|
Ngā whakaputa
nga roroa / Longer term outcomes
|
Increase in visitor numbers and expenditure
Increase in new businesses establishing in district
|
Growth of key industries and businesses
Economic impacts and opportunities of key projects
understood and realised Relocation
of Government Offices to Kāpiti Coast (combined 200+ FTE)
|
Increase level of qualification attainment
Decrease in proportion of NEETs
Decreased rates of unemployment
Increase in investment into key industries and
businesses
|
Increased infrastructure investment in Kāpiti
Coast
Manu whenua aspirations realised
|
Growth of key industries and businesses
Reduction in emissions and increased climate
resilience
Sustainable multi-sector partnership and
collaboration
|
|
Impacts
|
Employment Growth – increase in local
employment options and pathways
|
Mean Income Growth – increase in higher paying
local employment and income generating opportunities
|
Business Unit Growth – increase in businesses
establishing, expanding and moving to the district
|
GDP Growth – increased growth of the local
economy and key sectors.
|
|
|
|
|
|
|
|
|
|
Detailed
action plans
The following section
details the specific actions that form the basis of the implementation plan for
this Strategy. Each of the proposed actions have been prioritised using a
rating of 1, 2 or 3, with those actions rated 1 being the top priority for delivery.
For each action, we have identified the lead agency who will drive the delivery
with identified partners that may have direct involvement or function in an
advisory / information only capacity. We then describe how lead each lead
agency will work with partners to deliver the key action. Finally, we have set
out an anticipated timeline for the start and completion of each
action.
Ngā Pou / Pillar: Whakapapa / Positioning
the Kāpiti Coast
The aim of the Whakapapa / Positioning the
Kāpiti Coast pillar is to celebrate our rich culture and identity and
highlight the opportunities and advantages of the Kāpiti Coast to increase
visitation, support the growth of new and existing businesses and grow the
district’s residential population. Proposed
actions are detailed in Table 1.
Table 1: Whakapapa / Positioning the
Kāpiti Coast – Key Actions
|
Nga Mahi / Action
|
Priority
|
Lead
|
Partners
|
How we will work
|
Delivery
|
|
Complete
the development and implementation of the Kāpiti Coast Destination
Story, including an update and refresh of the Kāpiti Coast destination
website including business research, develop a set of marketing and
promotional material - available for use by the Council, partners and
stakeholders, including business and community. Secure dedicated marketing
resource and budget.
|
1
|
KCDC
|
Iwi,
WellingtonNZ, Chamber, Manaaki, Kāpiti Arts & Creative Industries
group and other Industry Groups, Youth Council.
|
KCDC
will lead this action with input and support sought from our partners.
Further work with iwi, businesses and partners will be required on an ongoing
basis to keep the story relevant and up-to-date.
|
Jul
20 - Ongoing
|
|
Facilitate
and support the delivery of major events and encourage greater business
connectivity and community involvement
|
1
|
KCDC
|
Iwi,
WellingtonNZ, Chamber, Community Boards, Event organisers
|
KCDC
will coordinate a process with partners to ensure greater awareness, support
and leverage of our Major Events.
|
Ongoing
|
|
Building
awareness of local resiliency and climate change opportunities in Kāpiti
Coast, looking both at the opportunity to attract new businesses and to
improve the resilience of existing industries in the district.
|
2
|
KCDC
|
Iwi,
GWRC, WellingtonNZ, Chamber, Community Boards
|
Council
will work with partners to enhance and promote the Kāpiti Coast’s
climate change and resilience opportunities.
|
Sept
20 – Sept 21
|
Ngā Pou / Pillar: Kaitiakitanga / Open for
opportunity
29.
The aim of the Kaitiakianga
/ Open for Opportunity pillar is to adopt a customer focus that
enables all participants in the economy to operate to their full potential and
contribute to a vibrant economy while protecting the natural environment.
Proposed actions are detailed in Table 2.
Table 2: Kaitiakianga / Open for Opportunity – Key
Actions
|
Nga Mahi / Action
|
Priority
|
Lead
|
Partners
|
How we will work
|
Delivery
|
|
Deliver
a welcoming and customer focused approach to council services that works in
partnership with others.
|
1
|
KCDC
|
Iwi,
Industry, Chamber, Community.
|
KCDC
to implement a process for evaluating improvement in our customer approach
across the organisation that is reported to Council and Community annually.
|
Aug
20- Ongoing
|
|
Provide
a coordinated approach to the facilitation of key opportunities
|
1
|
KCDC
|
Iwi,
Industry Groups, WellingtonNZ, Chamber
|
KCDC
will review its activities to ensure a coordinated approach is taken to
facilitate key investment and business opportunities in the district.
|
Aug
20 – ongoing
|
|
Ensure
effective policies and regulations, including the District Plan that support
growth and protect our environment,
ensuring they support quality growth outcomes and enables the effective and
efficient utilisation of available land; that meets the requirements of all
users, including business and housing.
|
2
|
KCDC
|
Iwi,
Development Community, Chamber, Industry Groups, Housing Taskforce,
Community, Youth Council
|
KCDC's
will work with partners to encourage clear communication and understanding of
new policies and regulations and that our community feel that they have had
the chance to be part of this process. A newsletter to industry will be
developed to support this.
|
Ongoing
|
|
Take
a targeted approach to attract new businesses and agencies to the Kāpiti
Coast, with an initial focus on increased Government presence and growing
more higher paid jobs and skills.
|
2
|
KCDC
|
Iwi,
WellingtonNZ, NZTA, Industry, Gvmt agencies
|
Council
will work with partners to drive the importance of Kāpiti Coast as a
District that offers resilience and diversity to businesses and to Government
agencies.
|
Aug
20 – Ongoing
|
Ngā Pou / Pillar: Whānau / Growing
Skills and Capability
30.
The aim of the Whānau /
Growing Skills and Capability pillar to enable innovation, creativity,
entrepreneurship and growth, while building connections and networks with local
talent in the community and supporting sustainable pathways for employment and
improving capacity for mana whenua participation. Proposed actions are detailed
in Table 3.
Table 3: Whānau / Growing Skills and Capability
– Key Actions
|
Nga Mahi / Action
|
Priority
|
Lead
|
Partners
|
How we will work
|
Delivery
|
|
Develop
and deliver a Workforce Plan including a youth initiative
|
1
|
KCDC
/ Iwi
|
Chamber,
Industry, MSD, Work Ready Kāpiti, Youth Council.
|
KCDC
will work with industry to understand workforce needs and skill gaps. KCDC
will work with partners to co-design a Youth Initiative for PGF – He
Poutama Rangatahi Fund and a programme to support connecting people with
disabilities with suitable employers, business opportunities and training
pathways.
|
Feb
20 – Jun 21
|
|
Develop
in partnership with our older persons and industry a program that offers
opportunities for older persons to re-enter the workforce e.g. contract,
mentor in business and supporting young people.
|
2
|
KCDC
|
Iwi,
Grey Power, Kāpiti Retirement Trust, Industry, Chamber, KEDA, Older
Persons Council
|
Chamber
will facilitate with partners the development of a programme for older
persons to re-enter the workforce, mentoring, training, supporting young
people into work etc
|
Feb
21
|
|
Facilitate
the growth and attraction of international education
|
2
|
Kāpiti
Coast College
|
KCDC,
WellingtonNZ, Youth Council, colleges, and schools
|
Council
and WellingtonNZ support Kāpiti's International Education Programme
through promotion and identifying growth opportunities.
|
Ongoing
|
|
Deliver
relevant business workshops and networking events. Create greater visibility
and increase access to training and networking in Kāpiti and Wellington
to support the growth and establishment of businesses in the district.
|
2
|
WellingtonNZ
/ Chamber of Commerce
|
KCDC,
Industry Groups and businesses
|
Wellington
NZ and Chamber will work with partners to understand training, business
workshop needs. Chamber will work with partners to promote networking events
|
Ongoing
|
|
Advocate
for tertiary and apprenticeship linkages that enable pathways, upskilling and
higher incomes linking with the Wellington Regional Workforce Development Strategy
|
2
|
KCDC
/ Iwi
|
Youth
Council, Universities, Weltec / Whiteirea, Wananga WellingtonNZ, Chamber of
Commerce, National Skills Academy
|
Co-designing
fit for purpose programmes based on industry need, growth and demand working
to enable a sustainable workforce and higher incomes.
|
Aug
20 – Ongoing
|
|
Develop
a business investment and support matching programme to support the growth
and establishment of businesses in the district..
|
2
|
KEDA
|
WellingtonNZ,
KCDC, Chamber of Commerce
|
Kick
Start Kāpiti will develop this programme with support from its partners
by way of advice and promotion.
|
Aug
20 – Dec20
|
Ngā Pou / Pillar: Kohahitanga /
Strengthening Partnerships and Leadership
31.
The aim of the Kohahitanga / Strengthening
Partnerships and Leadership pillar to achieve effective delivery and
implementation of this Strategy through strengthened partnerships and
leadership and recognise the partnership with iwi as mana whenua. Proposed
actions are detailed in Table 4.
Table 4: Kohahitanga / Strengthening Partnerships and Leadership – Key Actions
|
Nga Mahi / Action
|
Priority
|
Lead
|
Partners
|
How we will work
|
Delivery
|
|
Establish
an Economic Development Kotahitanga Board, which will be capability based and
led by an independent chair and finalise the monitoring and reporting framework
for the Strategy
|
1
|
KCDC
/ Iwi
|
Drafting
Group, Chamber, KEDA
|
KCDC
will work with Partners and Stakeholders to finalise an appropriate model and
Terms of Reference to setup and implement.
|
Aug
20
|
|
Support
the delivery of actions identified by iwi that enable the aspirations of mana
whenua.
|
1
|
Iwi
|
KCDC,
WellingtonNZ, industry, GWRC, DoC
|
Te
Whakaminenga o Kāpiti will work with partners to shape actions and how
they will be delivered for mana whenua.
|
Ongoing
|
|
Support
the development and delivery of Covid 19 recovery plan for the Kapiti Coast
|
1
|
KCDC
|
Iwi,
Industry, Wellington NZ, Govt, Chamber, Community
|
KCDC
will work with Partners and Stakeholders to develop and implement a recovery
plan
|
Aug
20 - Ongoing
|
|
Advocate
for increased access to affordable and social housing to support the growth
and retention of the local residents.
|
1
|
KCDC
/ Iwi
|
Community
|
Advocate
to Government to increase investment and support for increased social and
affordable housing by completing an analysis of the current housing
availability and impacts on community and personal wellbeing.
|
Sep
20 - Ongoing
|
|
Advocate
for improved transport infrastructure including the extension of the
electrification of rail to Ōtaki as a priority to support growth.
|
2
|
KCDC
|
WellingtonNZ,
NZTA, Elevate Ōtaki, Iwi, Community Boards, KEDA Chamber
|
Lobby
GWRC and Government's Transport Minister, as a District on the significant
economic impact.
|
Ongoing
|
|
Support
Elevate Ōtaki activities with the ongoing work pertaining to the
expressway and future opportunities.
|
3
|
Elevate
Ōtaki
|
KCDC,
Iwi, Ōtaki Community Board
|
Elevate
Ōtaki will continue to progress actions that came out of their
Ōtaki Business Survey.
|
Ongoing
|
|
Support
the redevelopment of the Waikanae Library in the Waikanae Town Centre
|
3
|
KCDC
|
Waikanae
Community Board, Iwi, Businesses, Destination Waikanae
|
Establish
a project advisory group inform the project vision, objectives and analysis
of potential future building options
|
June
20 - Ongoing
|
|
Support
the Wainuiwhenua project, Paekākāriki to understand the economic
impact of the proposal.
|
3
|
Wainuiwhenua
project
|
GWRC,
Iwi, Paekākāriki Community Board, KCDC, DoC
|
We
will support the Wainuiwhenua Project and partners to understand the economic
impact of the proposal.
|
Ongoing
|
Ngā Pou / Pillar: Manaakitanga / Supporting
Key Sectors
32.
The aim of the Manaakitanga /
Supporting Key Sectors pillar to grow industries and sectors that
provide the most potential for supporting improved economic wellbeing. Proposed
actions are detailed in Table 5.
Table 5: Manaakitanga / Supporting Key Sectors – Key
Actions
|
Nga Mahi / Action
|
Priority
|
Lead
|
Partners
|
How we will work
|
Delivery
|
|
Undertake
research to identify how best to support our high growth sectors, their
potential for further growth and current constraints and opportunities for
growth.
|
1
|
KCDC
|
Industry,
WellingtonNZ, Iwi
|
KCDC
will work with WellingtonNZ to identify and understand our high growth
sectors which will inform an industry specific growth plan.
|
Aug
20 – Jul 21
|
|
Develop
and implement a district wide Destination Plan which links into the Regional
Destination Plan.
|
1
|
WellingtonNZ
/ KCDC
|
Manaaki
Kapiti, Iwi, Industry
|
KCDC
will work with partners to develop and implement our Visitor Destination Plan
including strengthened air linkages and supporting infrastructure such as the
Gateway project.
|
Aug
20 – Mar 21
|
|
Support
the Kāpiti Creative Industries cluster group to develop the Kāpiti
Creative Industries Action Plan including attracting investment to assess the
feasibility of establishing a Creative Hub, skills development and visitor
attraction projects.
|
1
|
KACI
|
KCDC,
Kapiti Chamber of Commerce, WellingtonNZ, MBIE, Iwi.
|
KACI
will seek input, advise, and support from its partners to develop and
implement their industry action plan, including the identified actions
relating to the Creative Hub, skills development and visitor attraction
projects.
|
Jun
20 – Mar23
|
|
Encourage
the reduction of waste and emissions as both a way to cut costs but also have
a positive environmental impact
|
2
|
KCDC
|
Industry/business,
iwi, Chamber of Commerce
|
KCDC
will work with partners to promote that we provide waste audits for
businesses, support zero waste major events and will focus on working with
developments / builders to reduce waste from building
|
Sep
20 – ongoing
|
|
Support
the development and ongoing growth of industry led groups.
|
2
|
Industry
|
KCDC,
WellingtonNZ, education providers, Chamber, KEDA
|
Support
industry groups to identify their roadblocks to growth, training needs and wider
support opportunities and lobby on their behalf.
|
Ongoing
|
Accountability
33.
This section describes how the
Economic Development Strategy and Implementation Plan will be delivered with
transparency and accountability. This includes details on the approach to:
· Governance
· Prioritisation
· Monitoring and reporting
· Review
· Implementation timeline
Governance
34.
For all partners and stakeholders,
the ongoing arrangements for governance and delivery of this strategy and
implementation plan are as important as the proposed actions. There is recognition
that governance needs to be consistent, continuous, and effective.
35.
It is the shared view of Council,
our partners and stakeholders, that the governance of this strategy should be
independently led, and council supported with future transition to a more independent model. All partners and stakeholders are committed to
governance principles based on:
· Transparency
· Accountability
· Stewardship
· Integrity
· Trust
36.
In this context, independence is
critical, but there is a need to ensure that partners and stakeholders work
together as a district to delivery this strategy. Recognising this, it is
agreed that:
· the Economic Development Kotahitanga Board is
established
· an independent chair is appointed by Council to build
trust, pull together a strong board and provide a unified strategic direction
· the board will be selected based on capability and
board members need to be able to work productively with multiple partners and
stakeholders within and outside the district
· a council representative will be an ex-officio member
of the board
· local iwi will be fully represented on the board
· council will provide support to the board.
· A separate Terms of Reference Agreement will be
developed and agreed with the Board.
37.
It is proposed that the initial
core responsibilities of the Board would focus on overseeing the Economic
Development Strategy, advocating for the Kāpiti Coast and for economic
development activities in the district, and being a relationship broker, with a
focus on the establishment of strategic relationships to progress economic
development opportunities.
The Board will also play an important role in finalising and agreeing the
monitoring and reporting framework for the Strategy. This recognises that given
the Covid-19 pandemic, there is a need to understand more fully the economic
impacts on the local economy and how these might effect our economic
performance and growth
Prioritisation
38.
The detailed action plans set out
previously contain a significant number of actions that will be progressed by
the Council and its key partners over the coming years. Looking across the
strategic pillars, Table 6 sets out each of the priority actions for year
1.
Table 6: Year 1 – Priority Key Actions
|
Pillars / Ngā Pou
|
Year 1 Priority Action
|
Delivery Timeline
|
|
Positioning
Kāpiti Coast / Whakapapa
|
Deliver
the Kāpiti Coast Story
|
Ongoing
|
|
Open
for Opportunity / Kaitiakitanga
|
Provide
a coordinated approach for key investment and business opportunities
|
Aug
2020 – Ongoing
|
|
Growing
Skills & Capability / Whānau
|
Develop
a Kāpiti Coast Workforce Plan, including youth initiative
|
Feb
20 – Jun 21
|
|
Supporting
key sectors / Manaakitanga
|
Develop
a Kāpiti Coast Destination Plan
and a strategy for one other key
sector
|
Aug
20 - Jun 2021
|
|
Strengthening
Partnerships and Leadership / Kotahitanga
|
Establish
an Economic Development Kotahitanga Board and finalise the monitoring and
reporting framework for the Strategy.
|
Aug
20
|
Monitoring and Reporting
39.
Monitoring progress and making
recommendations for the future is critical to a well-functioning Strategy and
Implementation Plan. It helps us know what is working and what might need to
change. These are important mechanisms for managing risk and holding each other
to account if implementation does not happen as it should.
40.
A half yearly report will be
prepared outlining progress to date against each of the actions, timeframes and
issues and risks. This report will be published with immediacy after each
meeting on the Council’s website. Elements of the report may be withheld
if there are reasons to do so, such as commercial-in-confidence information.
41.
The Chair of the Governance Board
will provide an in-person by-exceptions report to Council at least every six
months to detail progress against the Strategy and Implementation Plan, and
receive advice from elected members at this time on any improvements or
additional actions (which would require sufficient resourcing).
42.
The Chair of the Governance Board
will oversee development of an annual report for publication at the end of Year
1 and Year 2 of operations, identifying progress, risks, and next steps.
Council senior leadership and staff will make themselves available to work with
community members on actions and provide updates, as is deemed reasonable and
fair.
Review
43.
The Chair of the Governance Board
will commission a short (6 week) review mid-way through Year 2 to establish
whether the Strategy and Implementation Plan are on track and the governance is
working effectively. Recommendations will be provided to the Council and
reported on publicly.
The Chair of the Governance Board will initiate planning
for the next three years of the Economic Development Strategy and
Implementation Plan (i.e. 2023-2026) from the beginning of Year 3. In addition,
the annual reporting process will also serve as a mechanism for reviewing
progress and establishing future year priorities.
GDP
and growth
44.
GDP for the Kāpiti Coast
District was almost $2 billion in 2019 (2019 prices), growing by 1.5% on the
previous year. This was only half the rate of growth New Zealand experienced,
with grow of 3% between 2018 and 2019.
45.
Key sectors that contributed to
our GDP in 2019 include:
· Health care and social assistance - 10.2%
· Rental, hiring and real estate services – 9.8%
· Professional, scientific and technical services
– 9.8%
· Construction - 9.2%
· Manufacturing – 9.1%
· Retail trade – 6.4%
· Education and training -4.4%
These industries are also our biggest employers,
making up 70% of total filled jobs in the district. (More detail is provided in
the following sections on key industries and employment).
Appendix 1Figure 7: Proportion
of GDP 2019
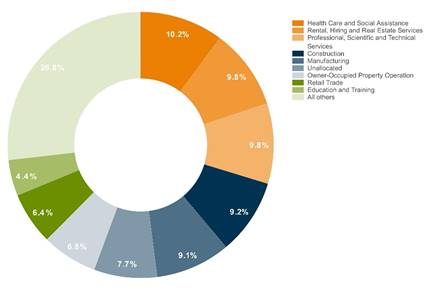
Source:
Infometrics
46.
Over the last 10-years, economic
growth in the district averaged 2.4% p.a. compared with an average of 2.5% p.a.
nationally.
47.
Health care and social assistance,
and the professional, scientific and technical services industries were the two
biggest contributors to economic growth during this time.
48.
Immediate future growth is
expected to be negative as a result of Covid 19 impacts. The districts economy
is predicted to contract by 7% over the year to March 2021. While the national
economy contracts by 8%. The construction and retail industries will experience
the largest decline in GDP over this time period.
Key industries
Construction
49.
Construction was the third largest
contributor to economic growth over the past decade. In 2019, construction
contributed $184m to GDP (9.2% of total GDP).
50.
In 2019, it was the largest
industry employer in the area. 2,805 people were employed in construction,
making up 15.9% of total filled jobs in the district.
51.
Construction is also an important
industry for those who are self-employed. 1,174 people were self-employed in
the construction sector. This is 41.9% of total employment in the construction
industry in 2019.
52.
House construction was the largest
employer within the construction industry in, comprising 594 of all jobs in the
industry, an increase of 44 jobs in the last year to March 2019.
53.
Large infrastructure investments
in the area also contribute to construction’s importance in the
district’s economy. Transmission Gully, a 27 km, 4 lane motorway which
runs from Paekākāriki (in the Kāpiti Coast District) south to
Linden (in Tawa), is likely to be completed by 2021. An expressway from Peka
Peka to Ōtaki is also expected to be open to traffic by 2021.
54.
Future projects include the
construction of a four-lane highway from Ōtaki to north of Levin by 2029.
Together these projects comprise a substantial portion of the Wellington
Northern Corridor. They will provide increased connectivity to the coast and
help support the construction industry long term.
55.
In the short term, Infometrics
expects that the amount of money spent on construction projects overall will
continue to decline due to Covid-19 impacts. This is expected to rise between
2022-25 as investment begins after a period of historically low construction
volumes and the government tries to stimulate the economy through
infrastructure projects, and housing demands continue.
56.
GDP for the industry is expected
to fall by $19.2 million between March 2020 and March 2021. Employment in the
industry is expected to fall by 326 jobs between 2020 and 2021 (a decrease of
11.6%). With this lower construction work likely to see the largest reduction
in Māori employment.
57.
Health care and social assistance
58.
The health care and social
assistance industry is the largest contributor to GDP in the district worth
$203.3 million in 2019 (10.2% of total GDP). It contributes a much higher
percentage towards GDP in the Kāpiti District than New Zealand as whole,
with the sector making up only 5.8% of national GDP.
59.
The industry is our second largest
industry employer, employing 2,540 (14.4% of total filled jobs) in 2019 and it
continues to grow. While a small number of jobs (23, a reduction of 0.9%) are
expected to be lost by March 2021 the industry’s strength will remain
over the next year and likely in the medium to long term. GDP of the industry,
in the Kāpiti district is forecast to increase by $0.61 million (or 0.3%)
between March 2020 and March 2021.
Aged care and support
60.
Aged care and support is the
largest driver of growth within the health care and social assistance industry.
Made up of aged care residential services, other residential services and other
social assistance services. It employs almost 62% of those working in the wider
health care industry (1,562 filled jobs in 2019).
61.
Within this figure, aged care
residential services remain the largest employer, employing 936 people in 2019.
This accounted for 5.3% of total employment in Kāpiti Coast in 2019.
62.
The aged care and support sub
industry is expected to continue growing in Kāpiti. Pre-covid projections
forecasted strong employment growth over the next 5-years for the industry.
Professional, scientific and technical
services
63.
The professional, scientific and
technical services industry was the third largest contributor to GDP for
Kāpiti, GDP for the industry was $195 million in 2019 (9.7% of total GDP).
64.
Between 2009 and 2019 the industry
added $67 million to the Kāpiti Coasts total GDP, making it the second
largest contributor to economic growth over the last 10 years. This growth is
reflected in employment growth figures which have averaged 4.0% since 2000.
65.
The industry is currently our
fourth largest employer, filling 1,650 (or 9.3% of total filled) jobs to March
2019. This figure is up by 2.9% on 2018 employment figures, ahead of the
national growth of 1.8% for the industry.
66.
Covid-19 will impact this industry
in the short term. Over March 2020-2021, this industry is expected to
experience around 140 jobs losses (a reduction of 8.3%). Early estimates for
the year ended March 2021 see GDP in industry reducing by 6.3% (the equivalent
of $12.6 million).
Retail
67.
The retail trade industry is the
districts eight largest contributor to Kāpiti Coast’s GDP, with GDP
of $128m in 2019 (6.4% of total GDP). This is growth of 3.6% on 2018.
68.
Employment was 2,146 in 2019. This
was 12.1% of total filled jobs for the district, making it our third largest
single employer by industry. Employment growth has averaged 1.1% while industry
growth has averaged 3.1% since 2000.
69.
Unfortunately, retail will take
one of the largest economic and employment hits due to Covid-19. By 2021 around
250 jobs will likely be lost due to Covid-19 (a reduction of 12%) and GDP is
expected to fall by $10 million (or 7.7%). This is a reflection of lockdown
restrictions, reduced tourism activity and reduced household spending.
Education and training industry
70.
The education and training
industry is our 9th largest single industry contributor to GDP,
contributing $87 million to GDP in 2019 (8.8% of total GDP for the district).
71.
1,559 people were employed in the
industry in 2019, making education and training our fifth largest employer. 31
new jobs were created in the industry in the last year.
72.
Education on the Kāpiti Coast
is reputable and strong with 3 colleges, Ōtaki’s tertiary
institution Te Wananga O Raukawa, as well as two Māori immersion
schools and two bilingual units within mainstream schools. We also saw a new
primary school open in 2018, reflecting the growth of our district and this
industry.
73.
Education and training is
relatively immune to the impacts of Covid-19 and growth of the industry in the
district is expected to continue. Employment is expected to increase by 1% (15
new jobs) between 2020 and 2021, while GDP for the industry is predicted to
increase by 0.2% (or $0.19 million).
Creative industries
74.
In New Zealand, the creative
industries do not have a dedicated industry division for statistical purposes
but are calculated based on activity within Arts & Recreation,
Manufacturing and Professional, Scientific and Technical Services. In 2017, the
New Zealand Institute of Economic Research calculated that the creative
industries sector cumulatively contributed $17.5 billion to New Zealand’s
GDP, and its 130,000 workers made up 6% of the national workforce.
75.
In 2019, the Kapiti Coast was
identified as having the fourth highest percentage of our workforce employed in
the creative sector in New Zealand, which is consistent with previous years (Figure 8).
Appendix 2Figure
8: Percentage of workforce employed in Creative
Industries
76.
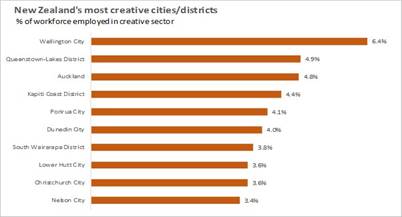
77.
The creative industries have been significantly
impacted by Covid-19 and support is needed to revive the jobs that are likely
to be lost within the sector. Modelling by Treasury suggests that without government intervention, the cultural sector
will be hit roughly twice as hard as the rest of the economy, and 11,000 jobs
could be lost within a 12-month period.
The Kapiti Arts & Creative Industries cluster
group has a key role in supporting the resilience of the sector and delivery of
recommended actions.
Tourism
GDP and employment
78.
In New Zealand tourism does not
have its own industry division for statistical purposes but is calculated based
on activity within several measured industries including accommodation and food
services, transport, retail trade, and arts and recreation services.
79.
In 2019 Kāpiti Coast’s
GDP attributable to the tourism industry was $98.2 million. This equates to
4.9% of total GDP for the district, compared to a 5.4% nationally.
80.
Both international tourist
arrivals and domestic tourism has increased in New Zealand over the past decade
and this increase has also been captured by the Kāpiti District. Growth in
tourism GDP for the Kāpiti Coast has averaged 6.5% over the last decade
compared to 8.1% in New Zealand. In absolute terms, tourism GDP in 2019
for the district was 1.9 times what it was 10 years prior ($52m to $98m).
81.
In 2019, the tourism industry
employed an average of 1,199 people, which equates to 6.8% of the Kāpiti
Coasts total employment in 2019. Employment growth has averaged 0.2% per year
over the last decade.
82.
Tourism in 2020 has experienced
significant reductions in activity due to Covid-19. Accommodation and food, and
retail services relying on tourism will experience job losses and reduced
spending in the district. Employment in accommodation and food alone is
expected to fall by 30% by March 2021 (the equivalent of 388 jobs).
Tourism expenditure
83.
Tourism expenditure captures the
amount of money visitors to the district spend while in the area (it is not the
same as tourism GDP).
84.
In 2019 both domestic and
international visitors spent $177 million in the Kāpiti Coast District, an
increase of 1.3% on 2018 spend.
85.
Domestic visitors make up a larger
portion of spending in Kāpiti (78.5%) than the Wellington Region (68.6%).
Conversely, international expenditure for Kāpiti (21.5%) as a portion of
total visitor spend is lower than the Wellington Region 31.4%. The following
figure illustrates this breakdown.
Appendix 3Figure 10: Domestic
and International tourism expenditure 2019
86.
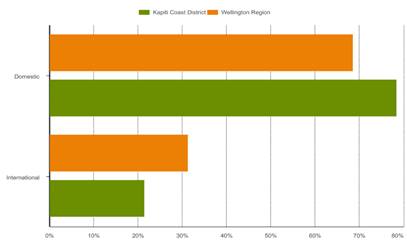
87.
88.
Growth in tourism expenditure has
fluctuated over the past decade and has recently plateaued. Covid-19 is likely
to further cement this trend. Infometrics projects that foreign tourism will
fall by 91% on pre-covid levels, over the next coming year with border restrictions
remaining in place. However domestic spending may only drop by 21%.
89.
Kāpiti’s relatively
high portion of domestic visitor spend (even compared to New Zealand figures)
signals that the area is an attractive area for New Zealanders to visit and so
despite poor economic conditions, there are opportunities to capture domestic
traveller spending over the coming year.
90.
Figure shows how total
tourism spending growth in the Kāpiti Coast District has changed between
2010 and 2019, relative to the rest of the country.
Appendix 4Figure 11: Tourism spending growth 2010-2019
91.
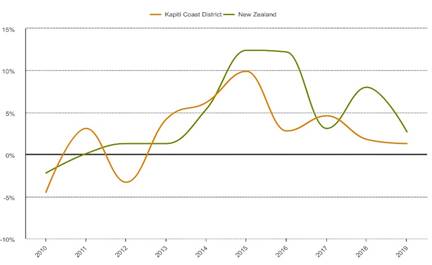
92.
Labour market and skills
Working age population
93.
In 2019, 31,570 people were
between that ages of 15 and 64, meaning 56.4% of our population was of working
age (compared with 64.9% nationally).
94.
This work age population is said
to support a non-working age population of 24,430 people (those between 0-14
and 65+ years of age). This means our dependency ratio is 77.3%. Much higher
than the national ratio of 54.1%.
Appendix 5Figure 9: Age
demographics Kāpiti Coast District compared to New Zealand 2019
95.
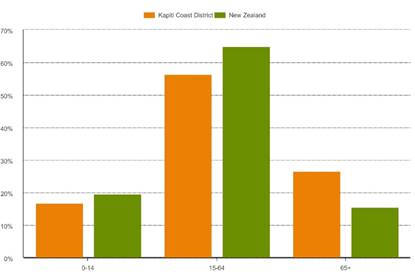
96.
Notes on population generally:
· Total population in 2019 was 56,000.
· Our young people (0-14) represent 16.9% of the
district’s population compared to 19.5% within the national population.
· Our district has a significantly higher proportion of
people 65 years and older, compared with New Zealand (26.7% compared to
15.6%).
Employment
97.
There were a total of 17,693
people employed (total filled jobs) in the Kāpiti Coast District in 2019,
up 1.7% from last year.
98.
Employment is concentrated in
several key industries that are strong contributors to the districts economy.
Over 60.5% of employment is attributed to the following industries:
· Construction – 15.9% of total filled jobs in
2019
· Health care and social assistance – 14.4%
· Retail trade – 12.1%
· Professional, scientific and technical services
– 9.3%
· Education and training – 8.8%
Employment growth in the district has remained
positive over the past 6 years. However, Covid-19 is expected to reduce this growth
to 1% in 2020 and contract in 2021, with negative 9.2% growth predicted. These
levels have not been witnessed at all over the past 20 years.
Just over 1,600 jobs are expected to be lost in the
district, with those in lower skilled jobs taking the largest hit.
Māori are expected to be disproportionately
impacted by these job losses. Māori employment experienced growth of 5.3%,
3.6% and 3.8% in 2017, 2018 and 2019, but this is expected drop to 0.7% in 2020
and contract by 13% in 2021, with 215 Māori estimated to lose their jobs
by 2021. 97 of these lost jobs are in low skilled employment.
Self-employment
99.
A total of 4,938 workers were
self-employed in the Kāpiti Coast District in 2019. 43% of these workers
worked within the construction, and professional, scientific, and technical
services industries.
100.
While the percentage of
self-employed workers has decreased from 28.8% to 27.9%, since 2015, this is
still a significantly higher self-employment rate than the 2019 national rate
of 16.2%.
Unemployment
101.
The unemployment rate for the
district has been steadily declining since 2013 when it reached a 10-year peak
of 6.7%. In 2019 the unemployment rate sat at 3.4% compared to the national
rate of 4.1%, indicating a tight labour market in the district.
102.
Unfortunately, Covid-19 will
reverse this trend. The unemployment rate is expected to be 8.3% by March 2021,
slightly lower than the national rate of 9.0%.
103.
Annual average Jobseeker support
recipients had been declining until 2019, when an average of roughly 1,500 people
received Jobseeker Support each quarter. Recipients of Jobseeker Support grew
by 10.8% between 2018 and 2019 compared to national average growth by 10.6%,
largely following national changes in benefit policies. Unfortunately, this
rate of growth is likely to continue due to declining economic conditions.
Appendix 6Figure 10: Unemployment
rate, annual average 2018 and 2019
104.
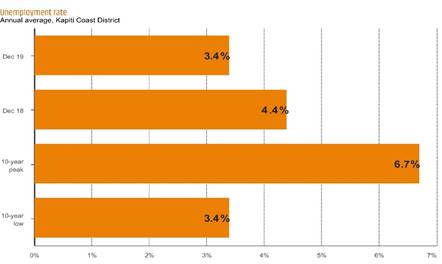
School leaver attainment
105.
Nearly 600 students from
Kāpiti Coast high school leavers in 2018, had achieved NCEA Level 2 or
above. This is the second highest proportion of school leavers with this
attainment level in the broader Wellington area (Figure ). Second only to
Wellington City which had the highest proportion of high school leavers with
NCEA Level 2 or above, at 90%.
Appendix 7Figure 14: Percentage of school leavers with NCEA Level 2 or
above 2018
106.
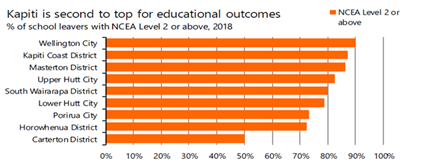
107.
A focus on maintaining strong
educational attainment for Māori will continue to be important on the
Kāpiti Coast. In 2018, 85% of Māori school leavers on the Kāpiti
Coast left school with an NCEA Level 2 or above qualification. This percentage
is much greater than the national average of 59% for Māori.
108.
Kāpiti Coast’s
Māori school leaver attainment at NCEA Level 2 and above was the highest
rate of attainment in the broader Wellington area in 2018 (Figure ).
Appendix 8Figure 15: Percentage of Māori school leavers with NCEA
Level 2 or above 2018
109.
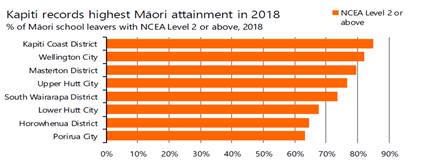
110.
Wellington City had the
second-highest level of Māori attainment, with 82% of Māori leaving
school in Wellington City in 2018 having achieved qualifications for NCEA Level
2 or above.
111.
Despite Kāpiti Coast’s
leaver attainment rates being higher than the national average, Māori
school leaver educational attainment on the Kāpiti Coast still remains
below the non-Māori result (Figure ).
Appendix 9Figure 16: Percentage of Māori school leavers with NCEA
Level 2 or above 2009-2018
112.
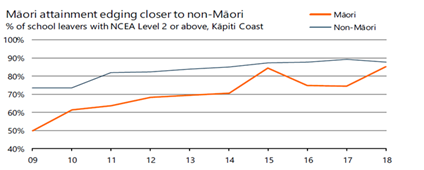
Consumer confidence
113.
Household confidence in the
district appeared strong at the end of 2019. Consumer spending was up 4.1% from
2018 figures, ahead of a 3.3% increase nationally.
114.
Spending in the district fell from
about $8.6 million per week between January and mid-March 2020 to just under $5
million during April 2020, during the lockdown period. Despite lockdown being
lifted, Covid-19 will likely continue to have impacts on this spending with job
losses expected.
Appendix 10Figure 17: Consumer
spending 2016 - 2019
115.
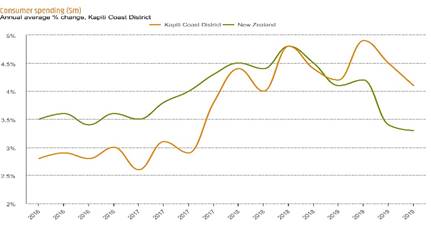
Incomes
116.
Mean average household incomes
have been steadily increasing year on year since 2009. In 2019, mean average
household income for the Kāpiti Coast District (2019) was $92,086, an
increase of 5.4% on 2018.
117.
For comparison, this is lower than
Porirua (City) and New Zealand which had average household incomes of
$133,000and $111,000, respectively. It is however higher than the Horowhenua
District where annual average household incomes were $80,000 in 2019.
118.
Mean annual earnings (a source of
household income) for the Kāpiti Coast was $48,805 in 2019, a 3.5%
increase on 2018 figures. Nationally mean annual earnings were $63,000 in 2019,
(a 3.8% increase on 2018).
Housing
Housing market
119.
Kāpiti Coast’s housing
market remains strong, with house values growing 10% over the year to September
2019 as the number of houses sold eased by 2.0%. As of December 2019, the
average house value was $620,275 for the district. This compares with the New
Zealand average of $699,954.
120.
It appears house values are
growing at a much faster rate in the Kāpiti Coast than the national
average. Values in Kāpiti increased by 8.1% between December 2018 and
2019, compared to an increase by 3.6% for average national values over the same
period.
121.
A buoyant housing market may make
home-owning households feel wealthier, providing a further boost to consumer
spending. However, renters and those looking to buy are struggling as the tight
Wellington housing market continues to influence prices and rents on the
Kāpiti Coast.
122.
The area becoming more attractive
to those living and working outside the coast could increase the workforce in
the district, potentially adding to the skills and talents of this workforce.
However, this is dependent on which demographic is attracted to the area and
whether people can afford increasing prices. Increasing house prices could also
push current residents and those within the current workforce out of the area.
Inequities are likely to become more apparent if this is not managed.
123.
Covid-19 now brings a lot of
uncertainty into the housing market. Current low interest rates are hoped to
reduce the burden for mortgage payments which could encourage some people to
buy. However, job losses, pay cuts and tightening spending generally could
reduce the demand in the housing market overall. The economic downturn could
also increase inequality within the area as those on lower incomes tend to be
disproportionately affected. This could influence who is able to buy and rent
within the districts housing market.
Housing affordability
As house values rise, and average incomes in the area
don’t keep pace, houses in the district are becoming less affordable. The
ratio of current average house values to average household income, the housing
affordability index, was 6.0 in the year to March 2019 for the district, which
was slightly lower than the national index of 6.1.
This index has been rising since 2016, indicating that
housing is becoming less affordable in the district. By 2019 the ratio had
converged to the national ratio, however COVID-19 now brings a lot of
uncertainty as to how affordable housing will be.
Rental affordability
124.
Rentals have generally become more
affordable in the Kāpiti Coast since 2000, however affordability is still
less than the New Zealand average. COVID-19 is also likely to reduce
affordability as average incomes drop.
125.
The table below shows how the
rental affordability index has changed over the past 20 years. This index is
the ratio of average weekly rent to average household income. A higher ratio
suggests that average rents cost a greater multiple of typical incomes, which
indicates lower rental affordability.
126.
The Kāpiti Coast had a rental
affordability index of 0.226 in 2019, higher (and therefore less affordable)
than the New Zealand average of 0.195.
Appendix 11Figure 18: Rental
affordability index 2000-2019
127.
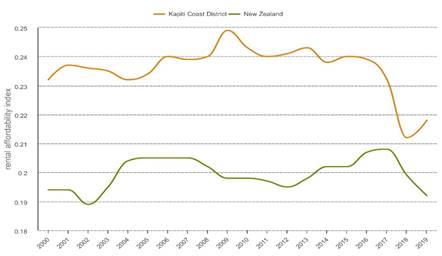
128.
129.
Appendix 2: Definitions
ANZSIC06 industry classifications
130.
This document refers to key
industries throughout. These industries are based on the 1-digit industry
categories from the 2006 Australia New Zealand Standard Industrial
Classification (ANZSIC).
131.
The ANZSIC is a hierarchical
classification of industries with four levels, namely divisions (the broadest
level also referred to as 1-digit categories), subdivisions (3-digit), groups
(4-digit) and classes (7-digit). There are approximately 500 7-digit
industries.
132.
Statistical information, such as
GDP and employment, is collected for each of these industries which are then
collated to provide overviews of. These
133.
Note: tourism and the art and
creative sectors are not part of these industry classifications but are derived
from these industries and their subdivisions, groups, and classes.
Gross Domestic Product
134.
Gross Domestic Product (GDP)
measures the value economic units add to their inputs. Total GDP is calculated
by summing the value added to all goods and services for final consumption i.e.
it does not include the value added to goods and services used as intermediate
inputs for the production of other goods as this would result in double
counting. As a result, GDP estimates should not be confused with revenue,
turnover or gross output. Where referred to in this report GDP is measured in
2019 prices.
135.
136.
Filled jobs
137.
Is simply the number of people in
paid work i.e those employed.
138.
Tourism expenditure
139.
Tourism expenditure captures the
amount of money visitors to the region (both domestic and international) spend
while in the area. It is not the same as tourism GDP but is an input into
calculating tourism GDP.
140.
Tourism GDP and employment
141.
Tourism is not classed as its own
industry under the ANZSIC but figures for tourism GDP are derived from various
sources which collect information on tourism related activity (e.g. Statistics
New Zealand’s Tourism Satellite Account, and guest nights, and visitor
expenditure data from MBIE).
142.
Tourism GDP is used as a basis to
calculate tourism employment. Within each industry it is known roughly how much
of the industries output is associated with tourism. This portion is applied to
the underlying employment levels in each industry to give tourism employment
for each industry. Then summed to provide an indication of the total number of
jobs in a region that are attributable to the tourism industry.
Dependency ratio
143.
Is the number of under 15 year
olds and over 65 year olds as a ratio of the rest of the population (the
working age population). A higher dependency ratio signals that there is a higher
burden on the working age population to support the non-working population.
Household income
144.
Household income captures labour
market earnings (wages, salaries and self-employment) as well as allowances
(e.g. Disability Allowance), benefits (e.g. Jobseeker Support) and
superannuation. Investment income is excluded. Figures for the Kāpiti
Coast District are determined by apportioning income information at a national
level to the district, based on various sources of administrative data.
145.
House values
146.
Is the current average value of
all developed residential properties in the area based on the latest house
value index from QVNZ. It is not the same household price i.e what is sold in
the market, but growth in each house’s prices do influence the measured
house value.
147.
Housing affordability
148.
Is the ratio of the average
current house value to average household income. A higher ratio suggests that
median houses cost a greater multiple of typical incomes, which indicates lower
housing affordability.
149.
Rental affordability
150.
Is the ratio of the average weekly
rent to average household income. A higher ratio suggests that average rents
cost a greater multiple of typical incomes, which indicates lower rental
affordability.
8 Matters
Under Action
8.1 Matters
Under Action
Author: Samara
Shaw, Executive Secretary to Group Manager People and Partnerships
Authoriser: Janice
McDougall, Group Manager People and Partnerhips
|
Recommendations
1 That
Te Whakaminenga o Kapiti note matters under action.
|
Appendices
1. Matters
under action ⇩ 
|
Te
Whakaminenga o Kāpiti Agenda
|
30 June 2020
|
TE WHAKAMINENGA O
KĀPITI
30 Pipiri 2020
|
Date Raised
|
Item
|
Action
|
Person Responsible
|
Notes/Update
|
Time
frame
|
|
|
Papakainga Housing Toolkit
|
Ms Foster committed to talking with Regulatory
Manager Natasha Tod to discuss approach to the production of a tool kit for
people who are keen to move forward with Papakainga Housing. Ms Hapeta
will be the point of contact and lead the work on such a Papakainga Housing
tool kit through the ART Forum.
|
Kirsten Hapeta
|
Mrs
McDougall provided an update work is underway on an assessment of housing
needs and opportunities and that the consultant, Clinton Fisher, was keen to
meet with Iwi as part of this process.
|
|
|
2019
|
Review of Te Whakaminenga o Kāpiti
|
Agreed at Te Whakaminenga o Kāpiti Meeting of
25 June that this could be added to the action register.
|
|
|
|