|
|
|
AGENDA
Council Meeting
|
|
I hereby give notice that a Meeting of the Kapiti
Coast District Council will be held on:
|
|
Date:
|
Thursday, 25 June 2020
|
|
Time:
|
9.30am
|
|
Location:
|
Council Chamber
Ground Floor, 175 Rimu Road
Paraparaumu
|
|
Wayne Maxwell
Chief Executive
|
|
Council
Meeting Agenda
|
25 June 2020
|
Kapiti Coast District Council
Notice
is hereby given that a meeting of the Kapiti Coast District Council will be
held in the Council Chamber,
Ground Floor, 175 Rimu Road, Paraparaumu, on Thursday 25 June 2020, 9.30am.
Council Members
|
Mayor K Gurunathan
|
Chair
|
|
Deputy Mayor Janet Holborow
|
Deputy
|
|
Cr Angela Buswell
|
Member
|
|
Cr James Cootes
|
Member
|
|
Cr Jackie Elliott
|
Member
|
|
Cr Gwynn Compton
|
Member
|
|
Cr Jocelyn Prvanov
|
Member
|
|
Cr Martin Halliday
|
Member
|
|
Cr Sophie Handford
|
Member
|
|
Cr Robert McCann
|
Member
|
|
Cr Bernie Randall
|
Member
|
2 Council
Blessing
“As we deliberate on the
issues before us, we trust that we will reflect positively on the
communities we serve. Let us all seek to be effective and just, so that with
courage, vision and energy, we provide positive leadership in a spirit of
harmony and compassion.”
I a mātou e whiriwhiri ana
i ngā take kei mua i ō mātou aroaro, e pono ana mātou ka
kaha tonu ki te whakapau mahara huapai mō ngā hapori e mahi nei
mātou. Me kaha hoki mātou katoa kia whaihua, kia tōtika
tā mātou mahi, ā, mā te māia, te tiro whakamua me te
hihiri ka taea te arahi i roto i te kotahitanga me te aroha.
3 Apologies
4 Declarations
of Interest Relating to Items on the Agenda
Notification from Elected
Members of:
4.1 – any interests that
may create a conflict with their role as an elected member relating to the
items of business for this meeting, and
4.2 – any interests in
items in which they have a direct or indirect pecuniary interest as provided
for in the Local Authorities (Members’ Interests) Act 1968
5 Public
Speaking Time for Items Relating to the Agenda
6 Members’
Business
(a)
Public Speaking Time Responses
(b)
Leave of Absence
(c)
Matters of an Urgent Nature (advice to be provided to the Chair prior to
the commencement of the meeting)
7 Mayor's
Report
Nil
8 Reports
8.1 Setting
of Rates, Due Dates and Penalties Regime
Author: Vicky
Silk, Rates Manager
Authoriser: Mark
de Haast, Group Manager Corporate Services
Purpose of Report
1 This
report requests that Council set the rates, due dates and penalties regime for
the 2020/21 financial year.
Delegation
2 Only
Council can set the rates, due dates and penalties regime for the 2020/21
financial year.
Background
3 The
Council must first adopt its 2020/21 Annual Plan before it can legally set the
rates in accordance with the relevant provisions of the Funding Impact
Statement Rating Policies for the 2020/21 financial year and its Revenue and
Financing policy.
Considerations
Policy
considerations
4 This
report is governed by the provisions of the Funding Impact Statement –
Rating Policies. No policy changes are proposed
Legal
considerations
5 The
Funding Impact Statement - Rating Policies and this report have been subject to
a full and detailed legal review from Simpson Grierson.
6 The
Hautere/Te Horo water supply rate category has been amended to “Fixed
charge per unit of allocation” to provide clarity to the basis of
charging for the closed Hautere water supply scheme.
Financial
considerations
7 The
total rates revenue requirement for the 2020/21 financial year is
$81.65 million (inclusive of GST). This represents an average rates
increase of 2.6% when compared to the 2019/20 financial year (excluding the
water conservation device loan rate).
8 A
recommendation was made to Council on 30th April 2020 that the
districtwide water supply fixed rate and districtwide water supply volumetric
rates would remain the same as those rates set for 2019/20.
9 The
districtwide water supply fixed rate is invoiced at a daily rate for
convenience. The daily rate for 2020/21 will change due to the 2019/20
financial year being a leap year containing 366 days and the 2020/21 financial
year contains only 365 days.
Tāngata
whenua considerations
10 There
are no tāngata whenua considerations arising from this report.
Strategic
considerations
11 There
are no strategic considerations arising from this report.
Significance and Engagement
Significance
policy
12 The
setting of rates for the 2020/21 financial year follows the 2020/21 Annual Plan
and is not in itself a matter that triggers the Council's significance and
engagement policy
Publicity
13 A
media release is planned subsequent to the Council adopting its 2020/21 Annual
Plan.
|
Recommendations
13 That
Council set the following rates under Section 23 of the Local Government
(Rating) Act 2002, on rating units in the Kāpiti Coast District
(District) for the financial year commencing on 1 July 2020 and ending 30
June 2021.
(1) Districtwide General Rate
A
Districtwide general rate set under section 13(2)(b) of the Local Government
(Rating) Act 2002 on all rateable rating units, assessed on a differential
basis on all rateable rating units in the District as follows:
· a
rate of 0.43834 cents in the dollar (inclusive of GST) of land value on every
rating unit in the urban rating areas of the District as per the
Council’s rating area maps;
· a
rate of 0.16657 cents in the dollar (inclusive of GST) of land value on every
rating unit in the rural rating areas of the District as per the
Council’s rating area maps with an area less than 50 hectares,
excluding those properties in the rural village differential rating areas;
· a
rate of 0.09643 cents in the dollar (inclusive of GST) of land value on every
rating unit in the rural rating areas of the District as per the
Council’s rating area maps with an area equal to or greater than
50 hectares plus rating units less than 50 hectares where a combination
of these properties total greater than 50 hectares and form part of one
farming operation, excluding those properties in the rural village
differential rating areas;
· a
rate of 0.30684 cents in the dollar (inclusive of GST) of land value on every
rating unit in the rural rating areas of the District which is located in the
rural village differential rating areas as per the Council’s rating
area maps.
(2) Districtwide
Community Facilities Rate
A Districtwide targeted rate for community facilities, set under
section 16(3)(a) and 16(4)(b) of the Local Government (Rating) Act 2002,
assessed on a differential basis on all rateable rating units in the District
as follows:
· all
rateable rating units other than Accommodation/Hospitality and Motels and
camping grounds - $702.00 (inclusive of GST) per separately used or inhabited
part of a rating unit.
· Accommodation/Hospitality
(other than motels and camping grounds) - $1,404.00
(inclusive of GST) per separately used or inhabited part of a rating unit.
· Motels
and camping grounds - $210.60 (inclusive of
GST) per separately used or inhabited part of a rating unit.
(3) Districtwide Roading Capital Value
Rate
A
Districtwide targeted rate for roading, set under section 16(3)(a) and
16(4)(b) of the Local Government (Rating) Act 2002, assessed on all rateable rating
units in the District as follows:
· a
rate of 0.05745 cents in the dollar (inclusive of GST) of capital value on
all rateable rating units in the District
(4) Districtwide Roading Land Value Rate
A
Districtwide targeted rate for roading, set under section 16(3)(a) and
16(4)(a) of the Local Government (Rating) Act 2002, assessed on all rateable
rating units in the District as follows:
· a
rate of 0.03028 cents in the dollar (inclusive of GST) of land value on all
rateable rating units in the District.
(5) Districtwide Stormwater Rate
A
Districtwide targeted rate for stormwater, set under section 16(3)(b) and
16(4)(a) of the Local Government (Rating) Act 2002, on all rateable rating
units in the District's stormwater drainage areas as per the Council’s
stormwater drainage rating area maps as follows:
· a
rate of 0.02131 cents in the dollar (inclusive of GST) of capital value on
all rating units.
(6) Districtwide
Water Supply Fixed Rate
A Districtwide targeted rate set under section 16 of the Local
Government (Rating) Act 2002, assessed on all rating units connected or
capable of being connected to the District’s water supply, assessed on
a differential basis as below. The Districtwide water supply fixed rate
is invoiced as a daily rate for convenience.
· General
- $222.00 (inclusive of GST) per separately used or inhabited part of a
rating unit.
· Medium
Scale - $199.80 (inclusive of GST) per separately used or inhabited part of a
rating unit.
· Large
Scale - $177.60 (inclusive of GST) per separately used or inhabited part of a
rating unit.
· Accommodation/Hospitality
– $444.00 (inclusive of GST) per separately used or inhabited part of a
rating unit.
· Serviceable
- $222.00 (inclusive of GST) per rating unit not connected to the
district’s water supply, but within 100 metres of a water main and
capable of being connected.
(7) Districtwide
Water Supply Volumetric Rate
A
Districtwide targeted rate set under Section 19(2)(a) of the Local Government
(Rating) Act 2002 on each rating unit which is provided with a metered water
supply service.
· Volumetric
rate of water consumed or supplied - $1.19 (inclusive of GST) per cubic
metre.
(8) Hautere/Te
Horo Water Supply Rate
A targeted rate for water supply
set under section 19(2)(a) of the Local Government (Rating) Act 2002 per unit
of water supplied by the Hautere/Te Horo water supply.
· A
fixed charge of $225.00 (inclusive of GST) per unit of allocation to the
Hautere/Te Horo water supply (annual allocation of 1 unit = 1 cubic metre of
water per day).
(9) Districtwide Wastewater Disposal Rate
A Districtwide targeted rate for
wastewater disposal, set under section 16(3)(b) and 16(4)(b) on rating units
in the Waikanae, Paraparaumu, Raumati and Ōtaki rating areas, as per the
Council’s rating area maps.
|
· General
- $407.00 (inclusive of GST) per rating unit connected to the sewerage
system. A rating unit used primarily as a residence for one household
shall not be treated as having more than one water closet or urinal.
· Community
- $203.50 inclusive of GST) per water closet or urinal connected to the
sewerage system.
|
|
· Educational
– $183.15 (inclusive of GST) per water closet or urinal connected to
the sewerage system.
|
|
· Recreational
- $101.75 (inclusive of GST) per water closet or urinal connected to the
sewerage system.
|
|
· Large
Scale Commercial/Residential - $203.50 (inclusive of GST) per water closet
or urinal connected to the sewerage system, where there is more than one
water closet or urinal.
|
|
· Serviceable
- $203.50 (inclusive of GST) per rating unit not connected to the sewerage system
but within 30 metres of a sewer main and capable of being connected.
|
(10) Paraparaumu/Raumati Community Rate
A targeted
rate set under section 16(3)(b) and 16(4)(a) of the Local Government (Rating)
Act 2002 as follows:
· a
rate of 0.00114 cents in the dollar (inclusive of GST) of capital value on
all rating units in the Paraparaumu and Raumati urban and rural rating areas
as per the Council’s rating area maps.
(11) Waikanae Community Rate
A targeted
rate set under section 16(3)(b) and 16(4)(a) of the Local Government (Rating)
Act 2002 as follows:
· a
rate of 0.00227 cents in the dollar (inclusive of GST) of capital value on
all rating units in the Waikanae urban and rural rating areas as per the
Council’s rating area maps.
(12) Ōtaki Community Rate
A targeted
rate set under section 16(3)(b) and 16(4)(a) of the Local Government (Rating)
Act 2002 as follows:
· a
rate of 0.00316 cents in the dollar (inclusive of GST) of capital value on
all rating units in the Ōtaki urban and rural rating areas as per the
Council’s rating area maps.
(13) Paekākāriki Community Rate
A targeted
rate set under section 16(3)(b) and 16(4)(a) of the Local Government (Rating)
Act 2002 as follows:
· a
rate of 0.01002 cents in the dollar (inclusive of GST) of capital value on
all rating units in the Paekākāriki urban and rural rating areas as
per the Council’s rating area maps.
(14) Commercial
Rate
A targeted
rate set under section 16(3)(b) and 16(4)(a) of the Local Government (Rating)
Act 2002 as follows:
· a
rate of 0.02891 cents in the dollar (inclusive of GST) of capital value
assessed on all rateable rating units used principally or exclusively for
commercial purposes.
(15) Water
Conservation Device Loan Rate
A targeted rate on those rating
units that have received an interest free loan (up to $5,000 plus GST) for
approved water conservation devices from the Council that has not yet been
fully repaid, set at 10% of the amount of the original loan plus GST.
14 That
all property rates (including Hautere/Te Horo Water Supply Rate, but
excluding Districtwide Water supply fixed and volumetric rates) be payable in
four equal instalments due on:
Instalment Due
Dates Penalty
Dates
Instalment
One 9
September 2020 10
September 2020
Instalment
Two 9
December 2020 10
December 2020
Instalment
Three 9
March 2021 10
March 2021
Instalment
Four 9
June 2021 10
June 2021
All payments
made will be receipted against the earliest outstanding rate amounts in
accordance with authorised accounting procedures.
15 That
water rates (excluding Hautere/Te Horo Water Supply Rate) be invoiced
separately on a quarterly basis dependent on when the relevant meter is read.
Due dates for each area are specified below:
|
Area
|
Water meters read during
|
Due date
|
Penalty date
|
|
Paraparaumu/Raumati/
Raumati Beach/Raumati South/ Paekākāriki
|
Jul-20
|
27-Aug-20
|
28-Aug-20
|
|
Oct-20
|
27-Nov-20
|
30-Nov-20
|
|
Jan-21
|
2-Mar-21
|
3-Mar-21
|
|
Apr-21
|
31-May-21
|
1-Jun-21
|
|
Otaki/Peka Peka/
Waikanae Beach
|
Aug-20
|
28-Sep-20
|
29-Sep-20
|
|
Nov-20
|
6-Jan-21
|
7-Jan-21
|
|
Feb-21
|
29-Mar-21
|
30-Mar-21
|
|
May-21
|
28-Jun-21
|
29-Jun-21
|
|
Waikanae/Nikau Valley/
Otaihanga/
Paraparaumu Beach
|
Sep-20
|
29-Oct-20
|
30-Oct-20
|
|
Dec-20
|
9-Feb-21
|
10-Feb-21
|
|
Mar-21
|
27-Apr-21
|
28-Apr-21
|
|
Jun-21
|
29-Jul-21
|
30-Jul-21
|
16 That
Council apply the following penalties on unpaid rates in accordance with
sections 57 and 58 of the Local Government (Rating) Act 2002:
· a
charge of ten per cent (10%) on so much of any property rate instalment that
has been assessed after 1 July 2020 and which remains unpaid after the due
dates as per paragraph 14, to be added on the penalty dates above.
· a
charge of ten per cent (10%) on so much of any property rates (including
previously applied penalties) assessed before 1 July 2020 which remain unpaid
on 2 July 2020. The penalty will be added on 3 July 2020.
· a
charge of ten per cent (10%) will be added to any portion of a current water
rates invoice that remains unpaid after the due date specified. Penalty will
be added on the penalty dates shown as per paragraph 15.
17 That
property and water rates be payable by cash, cheque and eftpos at any of the
following places:
· Paraparaumu,
Civic Building, 175 Rimu Road, Paraparaumu
· Waikanae
Service Centre, Mahara Place, Waikanae
· Ōtaki
Service Centre, Ōtaki Library, Main Street, Ōtaki
· New
Zealand Post, countrywide
· Westpac
Bank, countrywide (excluding water supply rates)
· Greater
Wellington Regional Council, Shed 39, 2 Fryatt Quay, Pipitea, Wellington
· Greater
Wellington Regional Council, 35-37 Chapel Street, Masterton
18 Alternatively,
payment of the due rates can be made to the Council by direct debit, internet
banking, direct credit, telephone banking and credit card (subject to a
convenience fee) through the Council’s website.
|
Appendices
Nil
8.2 Adoption
of 2020/21 Annual Plan
Author: Chris
Pearce, Manager, Corporate Planning & Reporting
Authoriser: Mark
de Haast, Group Manager Corporate Services
Purpose of Report
1 This
report seeks the Council’s adoption of the 2020/21 Annual Plan.
Delegation
2 Only
the Council can adopt an Annual Plan under the Local Government Act 2002.
Background
3 The Local Government Act
2002 (the LGA) requires councils to prepare and adopt an Annual Plan before
setting their rates, for each financial year in between their Long Term Plans.
4 The Toitū
Kāpiti Long Term Plan 2018-38 (LTP) adopted in June 2018 set the
Council’s strategic direction for three years, and the significant
decisions about the Council’s work programme for 2020/21 have already
been made and consulted on in that context. Therefore, the starting point
for the 2020/21 Annual Plan was focused on delivering the third and final year
of the LTP.
5 During February, March and
April 2020, Elected Members and Officers participated in workshops to develop
the 2020/21 Annual Plan. A number of financial adjustments were proposed
to keep average rates increases as low as possible. The most impactful of
these adjustments was the removal of inflation from operating budgets, and
maintaining the level of non-funded depreciation (instead of reducing
it). The average rates increase for 2020/21 resulting from these changes
is 2.6% (lower than the 3.8% forecast in the LTP). Further discussion on these changes are covered in the
report to Council on 30 April 2020 (see agenda
item 8.2).
6 Whilst there are some
differences included in the 2020/21 budget (discussed at paragraph 12 of this
report), there are no significant new spending proposals or changes in service
levels included in the 2020/21 Annual Plan. Therefore, Council did not formally
consult on the draft 202/21 Annual Plan but instead, undertook an information
campaign to inform the community of the draft Annual Plan content. Feedback was
invited and further detail on the feedback received is included at paragraphs
19 to 22 of this report.
7 At the meeting of 28 May
2020, Council approved the fees and charges schedule for 2020/21. This
was approved earlier than the Annual Plan itself to allow Council to
communicate some charges for 2020/21 to customers as early as possible.
Some minor amendments to the schedule were approved which are detailed in the
report presented at the meeting on 28 May (see agenda
item 8.1).
Issues and Options
8 This section discusses the
following key issues for the 2020/21 Annual Plan:
· Major
capital projects planned in 2020/21;
· Key
drivers of the rates increase for 2020/21;
· The
2020/21 Capital Works Programme and “shovel ready” projects;
· Further
budget reviews planned in light of COVID-19; and
· Engagement
on the draft 2020/21 Annual Plan.
Major
capital projects planned in 2020/21
9 The following table
outlines the major capital projects planned for 2020/21 which had already been
signalled in the LTP and therefore are presented as information only; Council
is not required to approve these projects through the Annual Plan process.
|
Activity/project
|
Description
|
Capital cost ($000)
|
|
Drinking water safety and resilience
|
Start Hautere/Te Horo drinking water
safety upgrades.
|
1,300
|
|
Complete upgrade of Ōtaki water treatment
plant.
|
3,600
|
|
Continue to deliver the Waikanae Stage 2
treatment plant.
|
1,900
|
|
Wastewater
|
Complete inlet works for Paraparaumu
wastewater treatment plant
|
1,800
|
|
Stormwater
|
Start stormwater projects to protect
homes from flooding and improve downstream flow.
This includes: Kena Kena asset
upgrades; Moa Road flood wall; upgrades for Riwai Street, Sunshine Avenue and
Titoki Street; Kakariki Stream and Amohia Street stage 1 stream works; Amohia
catchment diversion stage 1 and Otaki Beach stage 2; and asset renewals in
Paraparaumu catchment.
|
4,300
|
|
Access and Transport
|
Continue SH1 revocation works.
|
1,400
|
|
Increase footpath renewals due to additional
NZ Transport Agency funding.
|
1,700
|
|
Paekākāriki seawall
rebuild
|
Begin the tender process for the construction
contract.
|
160
|
|
Otaraua Park development
|
Begin construction of stage 1 including an
amenity block - $1.5 million over the next two years.
|
701
|
|
Kāpiti Island Gateway Centre
|
Complete design and other preparatory work for the building of
the Gateway.
|
255
|
Key drivers
of the rates increase for 2020/21
10 In addition to the work programme
already included in the LTP, a number of amendments to the draft operating
budget for the 2020/21 Annual Plan were proposed in workshops 1 & 2
(February 11 & 13).
11 These amendments reflect
Council’s response to several changes in the operating environment,
including new central government requirements (proposed new water regulations),
and increased costs of managing assets.
12 Most of these
items were proposed prior to the COVID-19 situation and are still considered necessary
for the Council to continue delivering services at current levels throughout
2020/21. Additional COVID-19 related funding has also been included to
support ratepayers and businesses affected financially by COVID-19 and to
support Council’s Recovery Plan actions. The following table
details these changes.
|
Activity/project
|
Description / reason for
change
|
Cost ($000)
|
|
Water supply
|
Increase funding to prepare for
requirements of increased regulation and reporting as part of the Drinking
Water & Safety resilience programme
|
83
|
|
Economic
Development
|
Additional funding for Provincial Growth Fund liaison and to ensure Elevate Ōtaki
support is budgeted.
|
110
|
|
Community
Facilities
|
Increase the level of
maintenance on our housing portfolio
|
78
|
|
Additional net cost increase to
manage Waikanae Library medium term solution
|
40
|
|
Parks & Open
Spaces
|
Additional costs to carry out
parks maintenance and operations including new reserves to maintain, and CWB
work on local routes.
|
232
|
|
Reduced lease revenue budget to
align with current levels (top-up to now be funded by rates).
|
58
|
|
Recreation &
Leisure
|
Reflect actual resourcing
requirements and revenue levels, and
ensure adequate library casual staffing budget.
|
192
|
|
Coastal Adaptation
|
Additional funding required to
deliver the community-led coastal adaptation programme.
|
300
|
|
Governance
|
Increased remuneration for
Elected Members (as required by the Remuneration Authority).
|
124
|
|
Asset Management
Improvement
|
Increased resourcing to focus on
asset management improvement recommendations.
|
190
|
|
Information &
Communications
|
Deliver increased ICT capability
as part of ICT Strategy implementation.
|
200
|
|
COVID-19 related
funding
|
Continue support for ratepayers
and businesses affected by COVID-19
|
233
|
|
Budget to support
Council’s COVID-19 Recovery Plan actions
|
250
|
|
Subtotal
|
2,090
|
The 2020/21
capital works programme and “shovel ready” projects
13 The total amount of the capital works
programme for 2020/21 is $37.5 million (the upper limit of the financial
strategy is $38 million), including capex carryovers from 2019/20, partly as a
result of project delays due to the Covid-19 lockdown. Details of all
planned capital spending is included on pages 74 to 80 of the Annual Plan
attached at Appendix 1 to this report.
14 In April 2020, Council submitted
projects to Crown Infrastructure Partners (CIP) to be considered for Government
funding by the Infrastructure Industry Reference Group. The five projects
in the table below have progressed for consideration by the Government.
|
Projects
|
Estimated cost
|
|
Paraparaumu Link Road. To alleviate congestion
on Kapiti Road and connect key transport routes.
|
$24.5 million
|
|
Paekakariki Marine
Parade Seawall. To replace the deteriorating seawall (almost 1km in length).
|
$21 million
|
|
Districtwide Stormwater
upgrades. Carry out work to protect homes and commercial buildings from flooding.
|
$25 million
|
|
Water safety and
resilience project. To upgrade our drinking water supply infrastructure.
|
$20.1 million
|
|
Maclean Park
Development stage 2. To continue redevelopment of the park as a regional
destination.
|
$11 million
|
15 If any of Council’s projects are
successful in receiving funding from the Government, Officers will discuss the
financial implications with Council.
Further budget reviews planned
in light of COVID-19
16 It should be noted that the impacts of
COVID-19 on the Kāpiti Coast community are dynamic and the full impacts
will not be known for some time. In acknowledgement of this, Officers
will continue to monitor the COVID-19 situation to determine whether any budgets
should be reviewed throughout the year to identify potential
re-allocations.
Engagement on
the draft 2020/21 Annual Plan
17 During May 2020
Council informed the community about the draft 2020/21 Annual Plan,
highlighting the changes proposed in paragraph 12 as well as the major projects
planned and Council’s initiatives to respond to COVID-19.
18 Information on the draft 2020/21
Annual Plan was communicated to ratepayers via the fourth quarter rates
notices, the Kāpiti News, as well as the Council’s email newsletter
and Facebook. The community was invited to give feedback via email or to
get in touch with Elected Members.
19 We received feedback from six
individuals and specific requests from five organisations. Councillors
and Community Board chairs were provided with all feedback/requests in full on
5 June 2020, and feedback was discussed in a briefing with Councillors and
Community Board Chairs on 16 June 2020.
20 The central theme of the feedback from
the six individuals was a desire for Council to reduce costs to further reduce
the rates requirement for 2020/21, and same in future years.
21 The five organisations that submitted
requests through the draft 2020/21 Annual Plan were:
· Kāpiti
College (for Te Raukura ki Kāpiti, Performing Arts Centre);
· Kāpiti
Equestrian Advocacy Group;
· Paekākāriki
Surf Lifeguards Incorporated;
· Kāpiti
Cycling Action; andf
· NZ Festival of the
Arts
22 These requests ranged from requesting
collaboration with future activities to direct funding support for large
projects. For requests with a financial implication, Officers propose
that, unless Council has already communicated its position on a proposal
previously, that these are investigated as part of the development of the next
Long Term Plan for potential inclusion in future years.
Considerations
Policy
considerations
23 There
are no proposed changes to the Council’s existing policies contained in
the 2018-38 Toitū Kāpiti Long Term Plan.
Legal
considerations
24 By
adopting the Annual Plan the Council will fulfil its obligations under the
Local Government Act 2002.
25 The
Annual Plan is required to be published within one month after it is
adopted. The final document will be made available on the Council website
and in service centres and libraries.
Financial
considerations
26 The
overall financial considerations of the Annual Plan have been previously
discussed with Council in workshops and at the Council meeting on 30 April
2020. All three key elements of Council’s financial strategy, being
rates, capital expenditure and borrowings, remain within their respective upper
limits of the Council’s LTP financial strategy.
27 The
final 2020/21 Annual Plan includes the best estimate of likely capex costs that
need to be carried over from 2019/20 to 2020/21 and an additional $130,000 of
operating costs for increased insurance costs from Council’s recent
insurance programme renewal in May 2020. To maintain the average rates increase
at 2.6%, Officers have adjusted the annual depreciation budget to offset this
increase. Officers’ plan to further review depreciations costs during the
year.
28 Inflation has been added to capital
expenditure budgets ($739,000) to allow Council to meet its obligations on
contractual prices. The resultant interest cost on this adjustment is $18,000,
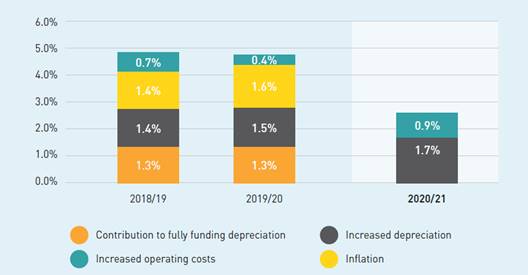
and has also been offset by an adjustment to the annual depreciation budget.
29 The
average rates increase for the 2020/21 financial year is 2.6% with a growth
component of 0.4%. This is made up of:
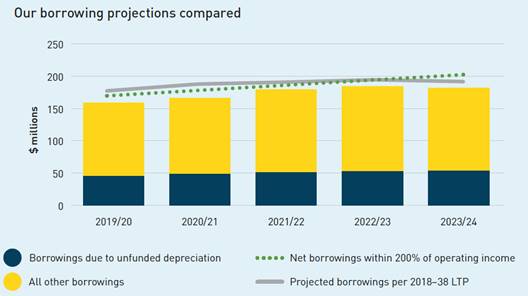
30 Council’s net borrowings are
planned to be $167 million or 189% of Council’s operating income at 30
June 2021. This is below $188 million forecast in the LTP.
Tāngata
whenua considerations
31 There
are no issues for consideration relating to iwi or the Treaty of Waitangi.
32 Council
will work with iwi as part of the COVID-19 recovery phase to identify
opportunities for community and central government funding to support
tāngata whenua/iwi through COVID-19, and to mitigate impacts of rates
increases as much as possible to support our communities in recovery.
Strategic
considerations
33 This Annual Plan is focused on
sustaining the community through an unprecedented disruption to its social and
economic environment. Therefore, the 2020/21 Annual Plan should be viewed in
context of the following long term goals:
· A
resilient community that has basic needs and feels safe and connected; and
· Wise
management of public resources and sustainable funding of Council services
34 It
should be noted that the deferment of depreciation funding will adversely
affect Council’s financial position in the short term, which will inhibit
achievement of one of the three-year focus outcomes - Improved financial
position against financial constraints.
Significance and Engagement
Significance
policy
35 This
matter has a low level of significance under Council’s Significance and
Engagement Policy.
Consultation
already undertaken
36 Community
Boards provided their input to the 2020/21 Annual Plan process through the
public workshops held in February and March 2020.
Engagement
planning
37 Council
has notified the community about the draft 2020/21 Annual Plan and received
feedback during May 2020.
Publicity
38 A
media advisory will be released following the adoption of the 2020/21 Annual
Plan.
Other
Considerations
39 Setting
the rates for 2020/21 is the subject of a separate report on the agenda for the
Council meeting on 25 June 2020.
|
Recommendations
It is recommended that the
Council:
40 Notes
the feedback received on the draft 2020/21 Annual Plan outlined at paragraphs
19 to 22 of this report.
41 Notes
the proposed approach to carry feedback requests that have financial
implications into the next Long Term Plan process, where applicable.
42 Notes
that the fees and charges schedule for 2020/21 was approved by the Council on
28 May 2020.
43 Adopts
the 2020/21 Annual Plan attached as Appendix 1 to this Report.
44 Delegates
to both the Mayor and the Chief Executive, the authority to make minor editorial
changes as required, to the 2020/21 Annual Plan attached as Appendix 1 to
this report, prior to its publication.
45 Notes
that the final 2020/21 Annual Plan will be published within one month after
adoption. It will be available on the Council website and in service
centres and libraries.
46 Notes
that the decision to set the rates for 2020/21 is part of a separate report
on the agenda of this Council meeting.
|
Appendices
1. Annual
Plan 2020/21 (under separate cover) 
8.3 Kapiti
Coast Economic Development Strategy
Author: Darryn
Grant, Economic Development Manager
Authoriser: James
Jefferson, Group Manager Place and Space
Purpose of Report
1 To
request approval to seek public feedback on the draft Kapiti Coast Economic
Development Strategy and Implementation Plan 2020-23.
Delegation
2 Council
has authority to make this decision.
Background
3 The
Kapiti Economic Development Strategy 2015-2018 was approved by the Environment
and Community Development Committee in December 2014. The strategy was
developed in collaboration with iwi and the business community and was endorsed
by the Kapiti Chamber of Commerce in January 2015. The strategy identified four
areas of focus over the three period:
· Leadership &
Responsiveness,
· Open for Business
(Council),
· Building
Capability and
· Positioning
Kapiti.
4 In
May 2015, a one-year transitional approach to governance of economic development
activity in Kapiti was approved, with a new community led governance structure
confirmed in July 2016. This governance arrangement has now ended, with no
leadership structure currently in place.
5 In
late 2018, a decision was made to refresh the current Economic Development
Strategy. The refresh process commenced with a number of partner / stakeholder
workshops to understand key concerns / issues with the current strategy and
economic development activity in the district. Feedback from these initial
workshops identified that the four existing focus areas were generally well
supported and remained relevant in the current environment, which was supported
by the economic data. The primary concerns identified in the workshops were in
relation to the delivery and leadership of economic development activities in
the district.
6 To
support the refresh of the Economic Development Strategy, a drafting group was
established and comprised the following membership:
· Councillor Angela
Buswell, representing Council
· Heather Hutching,
representing Kapiti Chamber of Commerce
· Jenna-Lea
Phillpott, initially representing Kapiti Economic Development Agency, later
independent representative.
· Liz Koh,
representing Kapiti Economic Development Agency (member since May 2019).
7 The
initial refresh process was supported by an external consultant in coordination
with the acting Council Economic Development Manager. However, this arrangement
discontinued in May 2019, with facilitation of the refresh transferred to the
Economic Development Team within Council, who worked directly with the drafting
group and other partners / stakeholders.
8 Regular
meetings were held with the drafting group over the period of the refresh of
the strategy. In addition, partner / stakeholder workshops were held, along
with meetings with iwi, individual businesses and business groups, community
boards and advisory groups. Workshops included specific sessions for each of
the identified Pou / pillars.
9 In
order to ensure that there was general agreement about the key areas of focus
for the strategy, a plan on a page was developed to help easily share the key
information. This included the vision, pillars, aims and key actions. An
example of this is shown below, a final version of this document will be
developed based on the final approved strategy.
Issues and Options
Issues
Delivery and Leadership
10 The
previous Economic Development Strategy was approved in December 2014 and it was
identified very early in the refresh process that many of the focus areas
identified previously still remained relevant now.
11 As
mentioned above, two key issues were raised early in the partner / stakeholder
workshops as being of significant concern, these were in relation to the
delivery and leadership of economic development activity in the district. A
community led governance arrangement had previously been approved and
established however the structure did not continue long term and as a result
there is now no formal coordinated approach to economic development activity in
the district.
12 Currently
economic development activities in the Kapiti Coast are primarily delivered by
two organisations; the Council and Wellington NZ, the economic development
agency for the Wellington region. There are also a number of volunteer /
membership based organisations involved in economic development / business
support and advocacy activities in the district including the Kapiti Coast
Chamber of Commerce (Chamber) and the Kapiti Economic Development Agency
(KEDA), as well as other local business or sector groups, which are generally
volunteer based organisations.
13 While
there are a number of parties involved in these activities there has been
limited coordination of activity and leveraging of skills and resources across
the various organisations. This has caused a high level of frustration and
mistrust for some members of the community and makes it difficult for groups to
sustain their activities.
14 In
developing the refreshed strategy, a number of steps are proposed to help
address the current situation and ensure a more coordinated and inclusive
approach to economic development activity. Firstly, the following vision has
been developed:
Through
partnership, support the growth of a vibrant, diverse Kapiti Coast economy that
provides increased opportunity, resilience and well-being for all.
15 The
vision was developed to recognise the need for a collaborative approach to
delivery of the strategy but also that there needs to be collective benefit
from the outcomes in the strategy in order to support long term growth.
Consideration needs to be given to all participants of the economy including
iwi, residents, business and visitors. The vision aligns with Council’s
vision of: thriving environment, vibrant economy, strong communities –
toitu Kapiti – the lifestyle choice.
16 In
addition, a specific Pou / Pillar has been proposed: Kotahitanga /
Strengthening partnerships and Leadership. A priority action is the
establishment of an independent Governance Board: Economic Development
Kotahitanga Board. In order for the strategy to be successful there needs to be
clear accountability, with a focus on:
· Independent
governance
· Clear
prioritisation
· Implementation
· Monitoring and
reporting
· Review and
adaption
17 Subject
to approval of the strategy, a separate Terms of Reference will be developed
for the Board, with key points for inclusion including
· the appointment of
an independent Chair and board members.
· full iwi
representation
· appointment of
members based on capability and not representation
· ex-officio
representation of Council via a Council appointed elected representative
· Council to provide
officer and resource support to the board.
18 Initial
responsibilities for the board will include overseeing the implementation of
the strategy, advocating for the district and economic activities in the
district and being a relationship broker, with a focus on establishing and
strengthening strategic relationships to progress economic development
opportunities.
Focus Areas
19 The
following Pou / Pillars were identified as part of the strategy refresh:
· Whakapapa /
Positioning the Kapiti Coast
· Kaitiakitanga /
Open for Opportunity
· Whanau / Growing
skills and capability
· Kotahitanga /
Strengthen partnerships and Leadership
· Manaakitanga /
Supporting key sectors
20 Under
each of the Pou / Pillars, an Whāinga / Aim and Key Actions were
identified along with short and medium term outcomes. A number of key actions
were identified in each Pou with an implementation plan developed to help
prioritise delivery of actions and identify lead organisations and key partners.
21 There
was one additional Pou identified for inclusion in the refreshed strategy:
Manaakitanga / Supporting key sectors. This was included after feedback was
received that there needed to be a greater understanding of the key sectors in
the district and a more targeted approach taken in coordination with industry
to unlock potential opportunities or roadblocks. A review of economic data
supports this approach and has been further supported following the different
impacts being felt across the different sectors as a result of covid-19.
22 Tourism
was identified as a sector that offered significantly more growth potential
given our rich cultural history, unique natural environment, proximity to large
domestic markets and currently low level of market penetration. In order to
support this sector, a proposed priority action is the development of a
Destination Plan in year 1 of the strategy. Although the tourism sector has
been impacted by Covid-19, we are not reliant on a high level of international
visitation, which has been a significant issue for destinations such as
Queenstown, Auckland or Rotorua. The opportunity to develop the Destination
Plan will unable as to work with industry to better understand and adapt to the
current environment and prepare for the recovery of the
sector.
23 There
was significant feedback about non delivery of actions during the refresh
process. In order to help ensure this doesn’t continue, key actions have
been outlined in the implementation plan to help assist organisations with
their future planning and activity prioritisation.
24 It
is noted that there are a number of activities with Council remaining the lead
delivery partner, while there was considerable support and willingness for
parties such as the Chamber or KEDA to lead the delivery of more actions, both
organisations raised concerns about their ability to deliver given they are
both volunteer based organisations with funding limitations.
25 It
will be necessary as part of the implementation process to understand the
support required by organisations such as the Chamber and KEDA to deliver
actions and the best ways to provide support for this going forward. This is
also the same for sector based industry groups, which are primarily volunteer
based.
26 The
following actions were identified as priority actions in year one of the
strategy:
· Deliver the Kapiti
Story
· Provide a
coordinated approach to the facilitation of key opportunities, such as the
attraction of new businesses and government agencies
· Develop a Kapiti
Coast Workforce Plan
· Establish an
Economic Development Kotahitanga Board and support the development and delivery
of a Covid 19 Recovery Plan
· Develop a Kapiti
Coast Destination Plan and a strategy for one other key sector
· Finalise the
monitoring and reporting framework for the Economic Development Strategy.
Covid – 19 Pandemic
27 In
March this year, New Zealand was impacted by the Covid – 19 Pandemic,
which is causing significant health, economic, social and cultural issues
globally. In response to the pandemic, the New Zealand Government put in place
a number of lock down restrictions, with some of these still remaining in place
now, such as restricted international border access into New Zealand.
Restrictions included the closure of all non-essential services and businesses,
which not only effected the businesses directly but the workers in those
organisations.
28 An
initial economic report on the impacts of Covid 10 has been received from
Infometrics and shows negative impacts across the district with reductions in
GDP and employment growth forecasted. Impacts are not consistent across sectors
or the workforce and initial forecasts indicate that sectors such hospitality,
tourism and retail will be impacted more than others. The report also shows
that a higher proportion of young people, Maori and low skilled workers are
forecasted to be impacted.
29 The
full impacts of Covid – 19 are not yet known and are unlikely to be fully
understood for some time. In order to support the recovery from impacts of the
pandemic, a separate recovery plan is to be developed for the district which
will include a work stream focused on economic recovery.
Outcomes and Impacts
30 In
order to measure the success of the strategy a number of medium and long term
outcomes have been included under each Pou / pillar. In addition to the
outcomes, four impacts have been proposed for measurement over the term of the
strategy:
· Employment Growth
– increase in local employment options and pathways
· Mean Income Growth
– increase in higher paying local employment and income generating
opportunities
· Business Unit
Growth – increase in businesses establishing, expanding and moving to the
district
· GDP Growth –
increased growth of the local economy and key sectors
31 Where
possible wellbeing outcomes have been taken into consideration however because
there is no consistent measure of economic wellbeing, more traditional measures
such as GDP growth have had to be utilised.
32 Given
the economic impacts of Covid 19, it is not considered appropriate to set
measures at the current point in time. As mentioned above the ongoing impacts
of Covid 19 are not yet fully known and control over many of these is outside
the influence of the actions in this strategy and linked more to the current
Macroeconomic environment.
33 Following
the establishment of the governance board, performance measures will be agreed
with the board. If there is still a significant level of uncertainty it is
proposed that a trend based approach is taken, with comparisons made against
other local and regional measures to see how the district’s economy is
tracking.
Strategy Format and feedback
34 A
copy of the draft Kapiti Coast Economic Development Strategy and Implementation
Plan 2020-2023 is appended to this paper. The strategy is in a draft layout
while feedback is received, with the final design and layout to completed once
approved by Council.
35 As
part of the final design process it is proposed that a short and long form
version of the strategy are developed, with an accompanying one-page document
to also be completed (Plan on a Page).
36 A
communications plan has been developed to support the feedback process. This
will include the use of Council’s social media and other channels to
create awareness about the opportunity to provide feedback on the strategy.
37 Drop
in sessions will also be organised so that people are able to come and talk
with officers or members of the drafting group about the strategy.
38 These
sessions will be targeted at the public given the engagement that has already
occurred to date with the business community and partners, however
opportunities will also be provided to ensure that iwi and other partners and
stakeholders have the opportunity to provide any additional feedback.
Considerations
Policy
considerations
39 There
are no policy considerations at this stage of the strategy.
Legal
considerations
40 There
are no legal considerations at this stage of the strategy and the strategy is
not required to follow the special consultative procedures set out in the Local
Government Act.
Financial
considerations
41 The
implementation of the strategy in year one will be funded from the existing
Economic Development budget. This will require reprioritisation of the existing
budget allocations to ensure alignment with the final agreed actions identified
in the strategy.
42 Further
activities / projects arising from these and other actions in year two and
three will need to be considered as part of the Long Term Plan process.
Tāngata
whenua considerations
43 In
addition to the existing Kapiti Economic Development Strategy there is also a
separate Strategy for Maori Economic Development and Wellbeing which was
adopted in July 2013. The purpose of the strategy is to set out how Council
will support Maori Economic Development in Kapiti. As part of this process,
discussions were held with iwi representatives about a combined strategy moving
forward which was generally supported by representatives.
44 During
the development of the strategy there have been briefings with Te Whakaminenga
o Kapiti. In addition to these briefings, individual workshops were offered
with representatives of all three iwi, with sessions held with representative
of Ngati Toa Rangatira and Te Ati Awa ki Whakarongotai.
45 Partnership
has been a core principal through the development of the strategy and this is
also correct in the delivery of the strategy. In order to support this
partnership and following feedback from members of Te Whakaminenga o Kapiti,
representation is proposed for all three iwi on the governance board for the
strategy; Economic Development Kotahitanga Board.
Strategic
considerations
46 The
draft Kapiti Coast Economic Development Strategy and Implementation Plan
2020-23 has been developed in line with the 2018 – 38 Long Term Plan,
with a focus on contributing to the development of a vibrant Kapiti Coast
economy.
Significance and Engagement
Significance
policy
47 This
matter has a low degree of significance under Council’s Significance and
Engagement Policy.
Consultation
already undertaken
48 As
outlined previously, during the development of the strategy, various different
forms of engagement and consultation were undertaken with different business
groups, stakeholders and partners.
49 The
engagement process included the formation of a specific refresh Drafting Group,
comprising of Council and community representation. Stakeholder and pillar
workshops were also held, along with attendance at business group meetings,
community board meetings and advisory group meetings. In addition, individual
meetings were also held with a variety of businesses and members of the
community.
|
Recommendations
50 That
the Council approves the draft Kapiti Coast Economic Development Strategy and
Implementation Plan 2020-23 for public feedback.
51 That
the Council acknowledges the input of the Drafting Group members in
completing the draft Kapiti Coast Economic Development Strategy and
Implementation Plan 2020-23
· Councillor
Angela Buswell
· Heather Hutching
· Jenna-Lea
Phillpott
· Liz Koh
|
Appendices
1. Draft
Kapiti Coast Economic Development Strategy and Implementation Plan 2020-23 ⇩ 
|
Council
Meeting Agenda
|
25 June 2020
|
Kapiti Coast Economic Development
Strategy and Implementation Plan 2020-2023
Draft Report
18
June 2020
|
Foreword 1
Executive
Summary 3
Introduction 10
Our
Economy and community 14
Strategic
Framework 20
Implementation
and Delivery 26
Governance
and Accountability 33
|
|
Appendix
1 : Our Economy 35
Appendix
2 : Definitions 47
|
tables
|
Table 1: Positioning the Kāpiti Coast – Key
Actions 27
Table 2: Open for Opportunity – Key Actions 28
Table 3: Growing Skills and Capability – Key Actions 29
Table 4: Strengthening Partnerships and Leadership –
Key Actions 30
Table 5: Supporting Key Sectors – Key Actions 32
Table 6: Year 1 – Priority Key Actions 34
|
figures
|
Figure 1: Our Strategic Pillars and Focus 6
Figure 2: Our Foundations for Success 11
Figure 3: Geography of the Kāpiti Coast 14
Figure 4: Population forecasts Kāpiti Coast 2013-2043 15
Figure 5: Ngā Pou 21
Figure 6: Kāpiti Coast Economic Development Strategy
– Strategic Framework 23
Figure 8: Proportion of GDP 2019 35
Figure 9: Wellington Region Creative Industries Employment 38
Figure 10: Domestic and International tourism expenditure 2019 40
Figure 11: Tourism spending growth 2010-2019 40
Figure 12: Age demographics Kāpiti Coast District compared
to New Zealand 2019 41
Figure 13: Unemployment rate, annual average 2018 and 2019 43
Figure 14: Percentage of school leavers with NCEA Level 2 or
above 2018 43
Figure 15: Percentage of Māori school leavers with NCEA
Level 2 or above 2018 44
Figure 16: Percentage of Māori school leavers with NCEA
Level 2 or above 2009-2018 44
Figure 17: Consumer spending 2016 - 2019 45
Figure 18: Rental affordability index 2000-2019 46
|
he wāhinga
kōrero Foreword
Nō mātou te maringa nui kia whakaputa atu tēnei mahere
rautaki, mahere whakamahinga. He mea whakawhanake tēnei nā ngā
iwi o te kotahitanga ki te tonga (ART), ngā hunga whaipānga me te
hāpori whānui. He kaupapa tāwharau tēnei i te koke whakamua
o te ōhanga puta noa i te hāpori o Kapiti. He hononga tōna ki te
mahere pae tawhiti (‘Long Term Plan’) o te Kaunihera o Kapiti, kia
kotahi mai ngā hāpori katoa o te rohe.
Mā te Poari Whakawhanake
Ōhanga Kotahitanga (Economic Development Kotahitanga Board) e whakahaere
te rautaki nei. Mā te mahi tahi e tautoko ai i te whakamahinga me te
tutukinga o ngā whainga matua. Me rite ka tika nā te nui o ngā
wero, ngā piki me ngā heke, hei tautoko i tō tātou
ōhanga me te hāpori mai i ngā wero pēnei i te Mate
Urutā (COVID19), aha atu, aha atu.
Ko te anga whakamua o te mahere rautaki nei hei
whakakotahi mai i te rohe whānui o Kapiti me ngā tari kāwana.
Hei tūāpapa mō te oranga tonutanga mō te hāpori
whānui mai Paekākāriki ki Ōtaki, mai i ngā maunga ki
te moana.
Te Whakaminenga o Kāpiti
I am pleased to present the Kāpiti Coast Economic
Development Strategy and Implementation Plan 2020-2023 that has been developed,
and will be delivered, in partnership with iwi, key partners, stakeholders, and
the community. The strategy has been developed with the overarching priority of
enhancing the economic wellbeing for all on the Kāpiti Coast. Our district
is alive with opportunity and the vision and outcomes of this strategy align to
that of our Long Term Plan, and focus on ‘building a stronger Kāpiti
Coast together’.
The implementation of this strategy will be overseen
by an Economic
Development Kotahitanga Board. This will be a collaborative governance model
which will not only support the delivery of our priority actions but will also
help ensure we can react to internal and external economic opportunities and
impacts, such as the Covid19 pandemic. We need to be able adapt to these
challenges and ensure that all participants in our economy are supported.
The next three years will see important and
significant changes, including the opening of major new transport
infrastructure, which will increase the attractiveness of the district to
visitors, new residents, and businesses. As a community we need to ensure we
can take advantage of this investment.
The approach outlined in the Strategy demonstrates the
importance of partnership and working together as a district along with other
regional and central government agencies to deliver on our proposed actions.
These provide firm foundations, enhancing our district and the economic
well-being of residents from Paekākāriki to Ōtaki, from the
beachfront to the hillside. We will tread carefully but deliberately, which
means taking specific, incremental steps that give us increased choices in the
future.
Mayor K Gurunathan
Introduction
As a district, the Kāpiti Coast is primed for
growth, significant new infrastructure is nearing completion, our population is
growing, and our attractiveness to the business and investment community is
only increasing. Opportunities for local partners to work together and for the
district to work more closely and strategically with our neighbouring regions
are happening and these collaborations are necessary to ensure better economic
outcomes and more inclusive growth.
This Economic Development Strategy and Implementation
Plan (the Strategy) provides a framework for growing the Kāpiti
Coast’s economy for the benefit of current and future residents, iwi,
communities and businesses. The Strategy covers the period 2020–2023 and
replaces the previous Kāpiti Coast Economic Development Strategy
2015-2018. The Strategy has been developed in kotahitanga / partnership and
will be delivered through kotahitanga / partnership. This will be fundamental
to our success and to building strong foundations and community well-being over
the next three years.
At this current moment, a key economic and well-being
concern for us all is the Covid-19 pandemic and how this will impact our
businesses and communities. The virus has already impacted many parts of our
economy, and it is expected that further impacts will emerge over time. A
separate recovery plan is being prepared for the district and this will be
guided by our longer-term aspirations, as well as the immediate impacts in our
community.
Wider strategic context
In developing this Strategy, we have also considered
the wider strategic context and the need for strong cooperation and commitment
at a national and regional level. This will be important to ensure effective
implementation and delivery and we will continue to pursue opportunities
associated with Central Government and other sources funding which can provide much
needed investment in the district as we continue to grow.
The Strategy’s objectives and actions also
recognise the importance of delivering inclusive and sustainable growth and we
are committed to enhancing the well-being of all our residents and communities
in the district.
Areas of opportunity
There are significant opportunities to further grow
and develop the Kāpiti Coast economy, including:
· increasing the awareness of the Kāpiti Coast as a
great place to live, visit and do business; highlighting our quality of life,
improved infrastructure, rich culture and resilience in order to attract more
residents, businesses and investment, and increase visitor spend and guest
nights
· enabling increased higher paying local job
opportunities in our communities, creating more employment and training
pathways for our young people / rangatahi including those not in education,
employment, or training (NEET’s), and facilitating opportunities for
industry to connect to the skills, talent and expertise of older people and
people with disabilities in the district.
· highlighting our key sectors and environment,
including what we have to offer in terms of manufacturing and service based
industries, creative industries, productive lands and niche & artisan
producers, attractions and parks, and working with iwi to unlock opportunities
for Māori-owned land and businesses.
· supporting and encouraging more businesses to start up
and establish in the district. Kapiti already has a high percentage of
self-employed residents, 27.9% compared to 16.2% nationally and the opportunity
exists to support further growth of these existing businesses, as well as
helping new businesses establish and feel welcomed.
Areas we need to improve
1.
There are also areas we need to
improve, including:
· continuing to develop and make the case for additional
efficient, effective, and resilient transport infrastructure across all of the
Kāpiti Coast and improving our connectivity to other centres
· developing, attracting, and retaining a skilled and
competitive workforce, based on an understanding of current and future
workforce needs, addressing skills gaps and shortages and facilitating greater
connections between businesses, education and training providers and our
communities
· improving community well-being including providing
pathways to higher income jobs and enabling local career progression,
supporting our young people / rangātahi with sustainable pathways to
employment and further training and encouraging entrepreneurship and
innovation. Ensuring older people and people with disabilities in our community
have the opportunity to contribute their skills and experience in a way that
recognises the unique contribution that they can bring as we continue to grow
and adapt.
· placing greater focus on growing and supporting our
partnerships with iwi, business and the community and providing strong
leadership and transparency, strengthening communication between groups and
building trust.
· support for key sectors and having a better
understanding of their potential for
growth and how best to facilitate and support this in partnership with the
sector. Initial focuses would include sectors such as Tourism and Creative
Industries.
Ngā Moemoea / Our vision
As a community we have developed a strategic vision,
Ngā Moemoea, that is at the heart of this strategy and highlights the
importance of partnership in our approach and inclusive growth for all members
in our community.
Through partnership, support the growth of a vibrant,
diverse Kāpiti Coast economy that provides increased opportunity,
resilience, and well-being for all.
To achieve this vision, our partners, businesses, and
communities have told us that we need to work together to:
· Celebrate our rich culture and identity and highlight
the opportunities and advantages of the Kāpiti Coast and attract domestic and international visitors,
residents, and businesses to the district.
· Adopt a business-friendly focus that enables all participants in the economy to
operate to their full potential and contribute to a vibrant economy while
protecting our natural environment.
· Enable innovation, creativity and entrepreneurship by continuing to build connections and networks with
local talent and supporting sustainable pathways for our current and future
employment requirements, with increased Maori employment pathways and business
initiatives.
· Strengthen partnerships and leadership, providing increased opportunity for quality local
entrepreneurship, growth and collaboration, while celebrating, protecting, and
strengthening our unique and distinctive community.
· Focus our efforts to grow those industries and sectors
that provide the most potential for
the Kapiti Coast economy and our community.
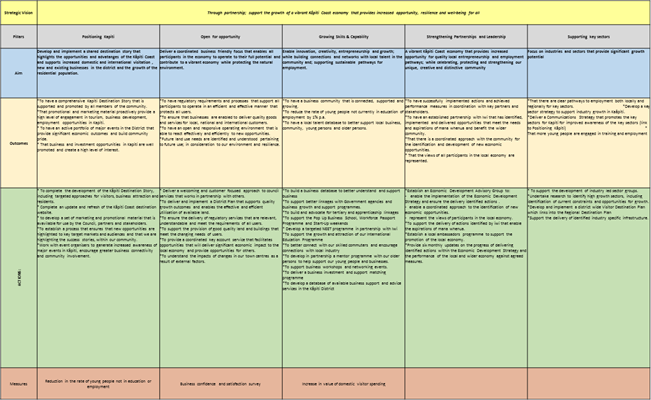
Our strategic pillars
The above vision and priorities shape the five
pillars, Ngā Pou, of this strategy, which are illustrated below in Figure 1.
Figure
1: Our
Strategic Pillars and Focus
|
Ngā
Moemoea / Vision
|
Through partnership, support the growth
of a vibrant, diverse Kāpiti Coast economy
that provides increased opportunity,
resilience, and well-being for all
|
|
Ngā
Pou / Pillar
|
WHAKAPAPA / Positioning the Kāpiti
Coast
|
KAITIAKITANGA /
Open for opportunity
|
WHĀNAU /
Growing skills and capability
|
KOTAHITANGA / Strengthening partnerships
and Leadership
|
MANAAKITANGA /
Supporting key sectors
|
|
Ngā
Whāinga / Aim
|
Celebrate our rich culture and identity and highlight the opportunities and advantages of the
Kāpiti Coast
|
Facilitate quality growth
|
Enable employment, innovation, creativity and
entrepreneurship and improve capacity for mana whenua participation
|
Delivery and implementation through strengthened partnerships
and leadership and recognises the significant relationship with iwi as mana
whenua
|
Grow industries and sectors that provide the most
potential for supporting improved economic well-being
|
|
Ngā Mahi /
Actions
|
Develop and deliver the Kāpiti Coast Story
Facilitate and support major events
Build awareness of Kāpiti Coast’s
resiliency and our climate change focus
|
Ensure a welcoming and customer focused approach to
council services
Have a coordinated approach to the facilitation of
key opportunities
Ensure effective regulations that support growth and
protect our environment, including the District Plan
Attract new businesses and agencies to the
Kāpiti Coast
|
Develop a Workforce Plan including a Youth Initiative
and opportunities for Maori, older people and people with disabilities.
Facilitate growth of international education
Advocate for local tertiary and apprenticeship
linkages
Enhance business networking and training opportunities
Develop a business investment and support matching
programme
|
Establish an Economic Development Kotahitanga Board
and finalise the monitoring and reporting framework for the Strategy
Support the development and delivery of a Covid 19
recovery plan
Support actions that enable mana whenua aspirations
Advocate for new and improved essential
infrastructure including electrification of rail to Ōtaki
Support unique economic opportunities in our
communities
Advocate for increased access to affordable housing
to support the growth and retention of local residents
|
Identify opportunities and barriers
experienced by key sectors, including high growth sectors
Develop a district wide Destination Plan to support
the growth of the visitor economy, including strengthened air linkages and
supporting infrastructure such as the Kāpiti Gateway.
Support the development and delivery of a Kāpiti
Creative Industries Plan
Encourage the reduction of waste and emissions
Support development of industry led groups
|
|
Ngā whakaputa
nga takawaenga / Medium term outcomes
|
Increased awareness of the Kāpiti Coast as a
destination
Increase in number of attendees at major events
delivered
|
Businesses recognise Kapiti as a great place to
establish and grow
Key industries and businesses feel supported
More businesses and organisations actively
considering the Kāpiti Coast
|
Improved match between workforce needs and skills
available
Increase in employment and training pathways for
young people and Maori
Increased business networking and awareness of
training and support
|
Increased business engagement
Increased advocacy for Kāpiti Coast
Increase in Government investment into district
|
Targeted actions to support growth of key industries
Growth of visitor economy
Improved resilience and climate awareness across key
industries and businesses
Industry led business groups established
|
|
Ngā whakaputa
nga roroa / Longer term outcomes
|
Increase in visitor numbers and expenditure
Increase in new businesses establishing in district
|
Growth of key industries and businesses
Economic impacts and opportunities of key projects
understood and realised Relocation
of Government Offices to Kāpiti Coast (combined 200+ FTE)
|
Increase level of qualification attainment
Decrease in proportion of NEETs
Decreased rates of unemployment
Increase in investment into key industries and
businesses
|
Increased infrastructure investment in Kāpiti
Coast
Manu whenua aspirations realised
|
Growth of key industries and businesses
Reduction in emissions and increased climate
resilience
Sustainable multi-sector partnership and
collaboration
|
|
Impacts
|
Employment Growth – increase in local
employment options and pathways
|
Mean Income Growth – increase in higher paying
local employment and income generating opportunities
|
Business Unit Growth – increase in businesses
establishing, expanding and moving to the district
|
GDP Growth – increased growth of the local
economy and key sectors.
|
|
|
|
|
|
|
|
|
|
Governance
and delivery
2.
The ongoing arrangements for governance
and delivery of this strategy are as important as the proposed actions. This
governance needs to be consistent, continuous, and effective.
3.
Recognising this, it is agreed
that:
· the Economic Development Kotahitanga Board is
established
· an independent chair is appointed by Council to build
trust, pull together a strong board and provide a unified strategic direction
· the board will be selected based on capability and
board members need to be able to work productively with multiple partners and stakeholders
within and outside the district
· a council representative will be an ex-officio member
of the board
· local iwi will be fully represented on the board
· council will provide support to the board.
· A separate Terms of Reference Agreement will be
developed and agreed with the Board.
4.
It is proposed that the initial
core responsibilities of the Board would focus on overseeing the Economic
Development Strategy and Implementation Plan, advocating for Kāpiti Coast
and for economic development activities in the district, and being a
relationship broker, with a focus on the establishment of strategic
relationships to progress economic development opportunities. The Board will also play an important role
in finalising and agreeing the monitoring and reporting framework for the
Strategy. This recognises that given the Covid-19 pandemic, there is a need to
understand more fully the economic impacts on the local economy and how these
will effect our economic performance and growth.
Priorities for year 1
5.
The implementation plan contains a
significant number of actions that will be progressed by the Board, Council and
its key partners over the coming years. In year 1 our priorities are to:
· Deliver the Kāpiti Story – which supports our positioning the Kāpiti Coast
pillar.
· Provide a coordinated approach to the facilitation of
key opportunities, such as the attraction of new businesses and government
agencies. – which supports our
open for opportunity pillar.
· Develop a Kāpiti Coast Workforce Plan– which supports our growing skills and
capability pillar.
· Establish an Economic Development Kotahitanga Board and support the development and delivery of
a Covid 19 Recovery Plan – which supports our strengthening
partnerships and leadership pillar and recognises the significant relationship with iwi as mana whenua.
· Develop a Kāpiti Coast Destination Plan, which
includes a focus on increasing opportunities for Maori business and a strategy
for one other key sector – which
supports our supporting key sectors pillar.
· Finalise
the monitoring and reporting framework for the Economic Development Strategy -
which will be agreed with the Board after the Covid 19 impacts are better
understood and will provide a framework for ongoing performance measurement
Purpose
of this strategy
The purpose of Economic
Development Strategy and Implementation Plan 2020-2023 (the Strategy) is to
provide a framework for growing and developing the Kāpiti Coast’s
economy for the benefit of current
and future residents, iwi, community, and business.
The objectives, actions and priorities proposed in the
Strategy are based upon:
· engagement and discussion with iwi, other partners,
and wider stakeholders to understand their perspectives and priorities for the
future of the Kāpiti Coast’s
economy
· an understanding of the strategic and policy context,
at a local, regional, and national level, and consideration of what these
mean for the Kāpiti Coast
· analysis of the Kāpiti Coast’s economy and
well-being, as well as an initial understanding of the impact of the current
Covid-19 pandemic.
The Kapiti Coast is primed for growth, with
significant new infrastructure being developed, and new amenities such as the
Te Raukura ki Kāpiti (Kāpiti Coast Performing Arts Centre), recently
completed. Our district has a lot to offer to new residents, businesses and
visitors and the district provides significant opportunity to support the
growth of a more resilient Wellington region.
Like all districts, there are also issues and
challenges that we need to address, while our infrastructure is improving there
is also a need to plan for the future and to consider what else is required to
make our existing industries and communities more attractive and
resilient. To continue to support quality growth we need to better understand
these opportunities and ensure these don’t impact our future potential.
We need to understand our key sectors, and emerging
opportunities, to strategically plan to enable sustainable growth. We need to
support our existing business and enable new businesses to grow. We also need
to attract more visitors, more talent, and more investment. We need to nurture
entrepreneurship and innovation and grow the skills and capability of our
industries. Critically, we also need to support our rangatahi/young people into
sustainable pathways to employment and leadership, particularly those not
currently in Employment, Education or Training (NEETs).
Our district, like others across the region and
nationally, faces the unprecedented challenge of responding to and recovering
from the Covid-19 pandemic. Understanding the ongoing and longer-term impacts
of the pandemic will be a priority for our businesses and community alike and
the District will prepare a recovery plan which will sit alongside this
Strategy.
Despite the immediate impacts and uncertainties
created by Covid-19, over the longer term, the Kāpiti Coast’s
economy is well positioned to grow and prosper, with opportunities for partners
to work together and for the district to work more closely and strategically
with our neighbouring regions. This collaboration will enable better economic
outcomes and more inclusive growth, benefiting our residents, communities, and
businesses.
These issues set the context for this Strategy which
replaces our 2015-2018 Economic Development Strategy and provides the framework
for the development of the Kāpiti Coast economy. A strong inclusive
economy means more opportunity and greater well-being for all and allows
individuals, whanau, and communities the freedom to pursue their own prosperity.
In this Strategy, we set out an implementation plan
with clear actions that have been developed with iwi, other partners, wider
stakeholders, and the community. These actions will be delivered through
partnership. This partnership will be fundamental to our success and to
building strong foundations with our communities across each of the
wellbeing’s over the next three years (Figure 2).
Figure 2: Our
Foundations for Success
7.
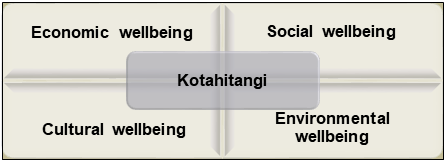
Wider
strategic context
In developing the strategy, we needed to consider the
wider strategic context for the district, which reinforces the requirement for
strong cooperation and commitment at a national and regional level. The
Wellington Regional Strategy (WRS), developed in 2007 and refreshed in 2012,
sets out a regional approach to support economic development and focuses on six
areas:
· commercialisation of innovation
· investment mechanisms for growth
· building world-class infrastructure
· attracting business, investment, and talent to the
region
· education and workforce development to service
regional economy needs
· being open for business.
The Wellington Regional Economic Development Agency,
WellingtonNZ, is tasked with progressing these areas and are committed to supporting
the implementation of this Strategy. Alongside the WRS, the Wellington Regional
Investment Plan and the Wellington Regional Growth Framework (currently being
prepared) have been developed in response to government’s request to have
a joined up approach on key issues such as housing, transport and supporting
the growth of business support in the region. The Wellington Regional Growth
Framework will provide a 30 to 100-year spatial plan for the region, alignment
with these will be important if we are to ensure the best possible partnership
with central government as a region including the Horowhenua District.
WellingtonNZ has also recently completed the
development of a Wellington Regional Workforce Plan and Government is currently
developing a National Workforce Leadership Group. To ensure that we can best
leverage these initiatives we will be developing a Workforce Plan for the Kāpiti Coast as one of the key priority actions of
this Strategy.
Greater Wellington Regional Council’s Māori
Economic Development Plan is also under development and is planned to be
launched in 2020. Council has discussed with iwi the continuation of a separate
Māori Economic Development Plan for the Kāpiti Coast or to be a
partner to this Strategy, or both. Iwi have indicated that being a partner in
this Economic Development Strategy and Implementation Plan was their preferred
choice and provided the best opportunity for a joined-up approach to realising
the potential of our current and future economy.
At a national level, we have seen a concerted focus
since early 2018 on unlocking productivity potential in the regions under the
Government’s Provincial Growth Fund (PGF). Kāpiti Coast was
announced as being eligible for the PGF in 2018 and the fund has already supported
projects in the district. More applications are being progressed and this
opportunity is likely to evolve as Government responds to Covid 19.
The Government’s focus on well-being brings an
inclusive growth focus to issues facing the country such as the housing shortage
and climate change. Well-being is crucial to sustainable long term economic
development and is a priority for the development and delivery of our
strategy.
Introducing
this strategy
The following sections of this strategy and
implementation plan set out:
· an overview of the Kāpiti Coast’s economy
and community, together with an assessment of the key opportunities and challenges
facing the district
· a strategic framework for the strategy which sets out
our vision and identifies our key strategic pillars, Ngā Pou, and
associated actions
· a detailed implementation plan, which identifies the
priority actions, lead agencies, key partners, and delivery timelines
· our arrangements for governance, monitoring and
accountability.
In addition, Appendix 1 provides a more detailed
assessment of the Kāpiti Coast economy and Appendix 2 provides definitions
of key terms contained in the strategy and implementation plan.
Our Economy and community
People
and place
We are a diverse, proud community - We are the
Kāpiti Coast.
9.
The Kāpiti
Coast District extends from Paekākāriki on the southern border
through to Ōtaki, and includes Kāpiti Island / Ko te Waewae Kapiti o Tara Raua ko Rangitane, a nationally important nature reserve (Figure 3)
Figure 3: Geography
of the Kāpiti Coast
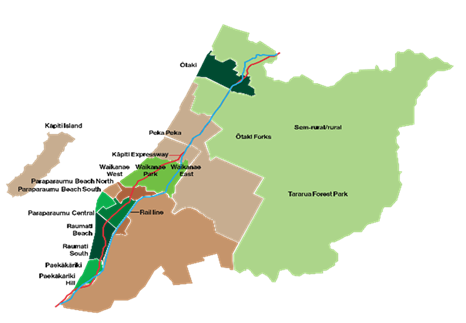
10.
11.
12.
The mana whenua – the people
with ‘authority and guardianship’ over the land’ – on
the Kāpiti Coast are Te Āti Awa ki Whakarongotai, Ngāti Raukawa
ki te Tonga and Ngāti Toa Rangatira. The Kāpiti Coast District
Council works in partnership with these three iwi under a longstanding
Memorandum of Partnership known as Te Whakaminenga o Kāpiti. We also
recognise that some Māori on this land identify with iwi outside the rohe
of the Kāpiti Coast.
Te Whakaminenga o Kāpiti
first met on 8 March 1994 and stems from two core principles of the Treaty of
Waitangi. The first principle, ‘partnership’, obliges both parties
‘to act reasonably, honourably and in good faith’. For that,
consultation is vital. The second principle, ‘active protection’,
requires the Crown to protect Māori in the use of their lands and waters
to the fullest extent practicable.
Our population is growing,
2,500 people joined our community in 2019 alone, an increase of 1.3% on our
2018 population. At least 56,000 people will call the Kāpiti Coast District
home in 2020, and this number is projected to continue growing as people are
attracted into the district.
13.
Forecasts from 2015 estimate that
our population will reach 68,548 by 2043 (Figure 4). This is an increase
of just under 1% growth per annum. Other districts such as Tauranga and Selwyn
have experienced population surges, and there is the strong potential for our
area to experience these same levels of growth. Any growth, if supported to be
sustainable, provides opportunities for increasing our workforce, our talent
pool, and growing our economy.
Figure 4: Population
forecasts Kāpiti Coast 2013-2043
14.
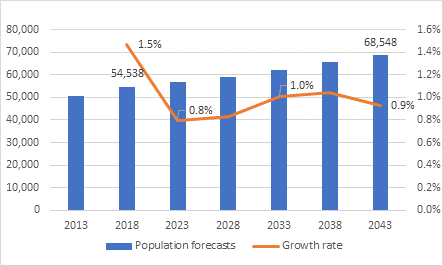
1 Source:
idcommunity (https://forecast.idnz.co.nz/kapiti)
15.
Our population is the second
oldest in New Zealand, with 27% of us aged 65 or older, up from 24% in 2009.
(Nationally this portion is 16%). Our working age population (15-64 years) is
10% smaller than the national average, and we also have a lower percentage of
young people (0-14 years old) than the national average.
16.
Our average household size is
smaller than the Wellington Region and for the rest of New Zealand. Almost
30% of us live alone, while around 65% live in one family households.
17.
We are within easy reach of the
capital city, meaning a high proportion (46%) of our residents travel daily for
work outside our district. We have pockets of wealth and pockets of
deprivation. On the New Zealand Deprivation Index (NZ DEP), Ōtaki
ranks as significantly deprived while most of the semi-rural and rural areas in
Kāpiti Coast are some of the least deprived in
New Zealand.
Economy and
industries
18.
Alongside the strategic and
demographic context set out in above, it is also important to understand the
Kāpiti Coast economy. Appendix 1 provides a high-level overview of the
economy and in the following section we provide a summary of:
· GDP and employment
· our key industries
· wellbeing.
GDP and
employment
In
2019, GDP for the Kāpiti District was almost $2 billion (2019 prices). On
average economic growth has been increasing steadily over the past 10 years at
2.4% p.a., in line with national growth of 2.5% p.a. However, the districts
economy is predicted to contract by 7% over the year to March 2021 as a result
of Covid 19 impacts.
Employment
figures were also positive in 2019 and our labour market was tight. A total of
17,693 people were employed in the Kāpiti Coast District in 2019. In the
same year, our unemployment rate was 3.4% (compared to the national rate of
4.1%).
Self-employment in the district is high. A total of
27.9% of workers were self-employed in the Kāpiti Coast District in 2019,
much higher than the national rate of 16.2%.
19.
However, as a consequence of the
impacts of Covid-19, employment growth is predicted to become negative 9.2% by
March 2021, with over 1,600 jobs expected to be lost in the district and those
in lower skilled jobs taking the largest hit (700). Despite this the unemployment
rate is predicted to be less than the national rate (8.3% compared to 9%), and
once recovery begins it is anticipated that there will be opportunities for
workers who have lost their jobs to be redeployed.
20.
A key priority of our strategy is
to develop a Workforce Plan and to understand current and future workforce
needs and the nature of the skills gap, this will help to inform the type of
training and / or tertiary provider we need to attract to our District.
21.
Achieving, and then maintaining
educational parity between Māori and non-Māori is important, to
ensure that young Māori have the skills and support to get well-paid
sustainable employment and be leaders in industry and the community.
22.
In 2018, 85% of Māori school
leavers on the Kāpiti Coast left school with an NCEA Level 2 or above
qualification. This percentage is much greater than the national average of 59%
for Māori. However, Māori school leaver educational attainment on the
Kāpiti Coast remains below the non-Māori result.
23.
Initial estimates have indicated
that young people and Māori are likely to be disproportionally impacted by
the economic impacts of Covid 19 and support will be needed to ensure that this
does not result in long term unemployment for these parts of our community.
Our key
industries
A key
set of industries continue to contribute to economic and employment growth in
the district. These include:
· Health care and social assistance – the biggest contributor to growth over the
past decade, worth 10.2% of the districts GDP in 2019 and accountable for 14.4%
of all filled jobs in the district. The strength of the industry is in part due
to our elderly and aging population which has increased the demand for aged
care services. While a small number of jobs (23, a reduction of 0.9%) are predicted
to be lost because of Covid 19, the industry’s strength will remain with
GDP forecast to increase by $0.61 million (or 0.3%) over the next year.
· Rental, hiring and real estate services – was worth 9.8% of the districts GDP in 2019,
and employed 12.1% of those employed in 2019. Our district has become
increasingly attractive and the growing housing market contributes to the
strength of this industry. A decrease of activity is expected for this industry
over the next year, with industry GDP falling by $5.7 million (2.9%) but
activity is likely to recover in the medium to long term.
· Professional, scientific and technical services – this was the second biggest contributor to
economic growth over the past decade. In 2019 the industry contributed 9.8% to
local GDP and accounted for 9.3% of filled jobs in the district. In 2019, 19%
of those who were self-employed worked in this industry. Covid-19 will impact
this industry in the short term, with 140 jobs losses (a reduction of 8.3%)
predicted, with a reduction of $12.6 million in GDP (or 6.3%) by March 2021.
· Construction
– as a steady employer in the area, construction accounted for 15.9% of
total filled jobs in 2019, and 9.1% of GDP. In 2019, almost a quarter of those
who were self-employed worked in this industry. Construction activity is
expected to decline in the short term, experiencing a reduction in GDP by 10.5%
(the largest in the district), but will likely grow steadily between 2022-2025
and is a key response focus for government.
· Manufacturing
– is a big contributor to GDP, worth 9.1% of total GDP in 2019, but
employs a smaller portion of the local workforce, accounting for 6.1% of filled
jobs in 2019. By 2021 only a small number of jobs will be lost in the industry,
but GDP is expected to fall by 5%.
· Retail trade
– is significant as an employer, accounting for 12.1% of total filled
jobs in 2019, but is less of a contributor to GDP, worth 6.4% of total GDP in
2019. By 2021 around 250 jobs will likely be lost due to Covid-19 (a reduction
of 12%) and GDP is expected to fall by $10 million (or 7.7%).
· Education and training - education on the Kāpiti Coast is reputable,
strong, and growing. The industry made up 4.4% of GDP and accounted for 8.8% of
total filled jobs in 2019. Covid 19 is expected to increase the demand for
education and training as workers reskill themselves for the future with
government announcing a number of schemes including apprenticeships to help
address significant unemployment. Access to tertiary education courses has been
impacted by the closure of the Whiteirea facility
· Tourism -
tourism GDP was $98.2 million, or the equivalent of 4.9% of the districts GDP
in 2019. The accommodation and food services industry which contributes to
tourism GDP is a big employer in the region accounting for 7.5% of filled jobs
in 2019. In 2020 tourism has experienced significant reductions in activity due
to Covid-19 however domestic visitor activity is predicted to help revive the
industry as restrictions allow. The district only has a small reliance on
international tourism and as a result has not seen the same level of impacts as
regions like Queenstown or Rotorua
· Creative Industries – the district is recognised as a creative area, with 4.2% of the
local workforce employed in the sector, and the fourth highest concentration of
creative jobs nationally, in 2019. However, Covid-19 is likely to have a severe
impact on most of this sector and efforts to revive jobs in the sector will be
needed.
24.
While recent economic performance
has been good for many sectors, unfortunately as shown above, Covid-19 will
likely reverse growth trends across most industries, with the full impacts not
yet known. This will also impact incomes in the district either through wage
reductions or job losses. As of 2019, mean annual earnings (a source of
household income) for the Kāpiti Coast was $48,805, which is already
significantly less than the national average of $63,000. More details are
provided in Appendix 1.
Well-being
25.
Sustainable economic growth is an
important contributor, but many factors determine people’s wellbeing such
as housing affordability, household income and mental health. Just because a
district or country is doing well economically does not mean all its people
are. We want all of our community to have the ability to share in the benefits
of a strong and growing economy. Making the best choices for current and future
generations requires working together to look beyond economic growth on its own
and consider social, environmental, and cultural implications.
26.
While there is still no single and
universally accepted definition or measurement of well-being there are a few
clear areas where action is needed if we are to improve the well-being and
quality of life of all our communities, including:
· Jobs and earnings – the Kāpiti Coast has a higher proportion of workers in
industries that are forecast to decline, leaving these workers more vulnerable
if these job losses do occur.
· Skills –
the Kāpiti Coast has a lower proportion of workers who are classified as
highly-skilled, reducing the potential for wage growth and higher paying jobs.
· Young people Not in Education, Employment or Training
(NEET) – the district
historically has a higher NEET rate than other parts of the country, making
pathways to employment more difficult and making it harder for employers to
maintain existing workforce levels in the future.
· Income and consumption – on average our householders have lower
household income figures, driven by a lower personal earning potential than
experience in other parts of the country and resulting in reduced local
consumption and increased pressures on housing and rental affordability.
Areas of opportunity
There are significant opportunities to further grow
and develop the Kāpiti Coast economy, including:
· increasing the awareness of the Kāpiti Coast as a
great place to live, visit and do business; highlighting our quality of life,
improved infrastructure, rich culture and resilience in order to attract more
residents, businesses and investment, and increase visitor spend and guest
nights
· enabling increased higher paying local job
opportunities for our communities, creating more employment and training
pathways for our young people / rangatahi including those not in education,
employment, or training (NEET’s), and facilitating opportunities for
industry to connect to the skills, talent and expertise of older people and
people with disabilities in the district.
· highlighting our key sectors and environment,
including what we have to offer in terms of manufacturing and service based
industries, creative industries, productive lands and niche & artisan
producers, attractions and parks, and working with iwi to unlock opportunities
for Māori-owned land and businesses.
· supporting and encouraging more businesses to start up
and establish in the district. Kapiti already has a high percentage of
self-employed residents, 27.9% compared to 16.2% nationally and the opportunity
exists to support further growth of these existing businesses, as well as
helping new businesses establish and feel welcomed.
Areas we need to improve
27.
There are also areas we need to
improve, including:
· continuing to develop and make the case for additional
efficient, effective, and resilient transport infrastructure across all of the
Kāpiti Coast and improving our connectivity to other centres
· developing, attracting, and retaining a skilled and
competitive workforce, based on an understanding of current and future
workforce needs, addressing skills gaps and shortages and facilitating greater
connections between businesses, education and training providers and our
communities
· improving community well-being including providing
pathways to higher income jobs and enabling local career progression,
supporting our young people / rangātahi with sustainable pathways to
employment and further training and encouraging entrepreneurship and
innovation. Ensuring older people and people with disabilities in our community
have the opportunity to contribute their skills and experience in a way that
recognises the unique contribution that they can bring as we continue to grow
and adapt.
· placing greater focus on growing and supporting our
partnerships with iwi, business and the community and providing strong
leadership and transparency, strengthening communication between groups and
building trust.
· support for key sectors and having a better
understanding of their potential for
growth and how best to facilitate and support this in partnership with the
sector. Initial focuses would include sectors such as Tourism and Creative
Industries.
Priorities for action
28.
In order to take advantage of these
opportunities and ensure we can make improvements where required there are a
number of actions we need to take, key priorities include:
· Addressing the skills gap – skills gaps are impacting all industries and
highly skilled people being the most competitively sort after. We need to
understand our current skills gap and the type of skills we will need in our
workforce and key sectors will need in the future.
· Supporting our rangatahi/young people – our young people are an important asset and
we need to create sustainable pathways to employment and further
training. Historically we have a relatively high proportion of young
people not in Education, Employment or Training (NEET) and large proportion of
the youth population leave Kāpiti Coast for education and employment
opportunities in larger centres. We need greater diversity with employment
opportunities for youth and greater connectivity to local businesses.
· Creating greater connections for older people and
people with disabilities into our economy – connecting older people and people with disabilities to local
businesses and key industries and creating more opportunity to share their
skills, experience and connections to support new and growing businesses,
entrepreneurs and workers.
· Growing higher Incomes – a high percentage of our workers are in low
income jobs compared to the rest of New Zealand (retail trade, health care,
social assistance, education, training, accommodation, food services). A
greater proportion of households are in the low and medium income groups.
· Attracting and utilising talent and skills – a total of 46% of workers live in Kāpiti
Coast but work outside the district, with 25% working in Wellington City where
their earning potential is currently often greater. Growing more highly skilled
local jobs is important as this large commuting workforce provides significant
unutilised potential that is not benefiting the local economy and resulting in
extended periods away from family and community which impacts overall
wellbeing.
· Developing better amenities and services– while there have been
improvements in our infrastructure, the district still has limited amenities
compared to other regions (e.g. no tertiary education facilities compared to
Wellington and Palmerston North; no hospital; no rail transport north of
Waikanae, infrequent bus services).
· Placing
greater focus on growing and supporting our partnerships and providing strong
leadership – these issues need a collective response, this means
providing leadership and transparency, strong communication, building trust and
partnerships to deliver our Strategy.
Ngā Moemoea / Our vision
The above context and supporting analysis, has
informed our vision for this Economic Development Strategy and Implementation
Plan. As a community we have developed a strategic vision, Ngā Moemoea,
that is at the heart of this Strategy.
Through partnership, support the growth of a vibrant,
diverse Kāpiti Coast economy that provides increased opportunity,
resilience, and well-being for all.
To achieve this vision, our partners, businesses, and
communities have identified the need to work together to:
· Celebrate our rich culture and identity and highlight
the opportunities and advantages of the Kāpiti Coast and attract domestic and international visitors,
residents, and businesses to the district.
· Adopt a business-friendly focus that enables all participants in the economy to
operate to their full potential and contribute to a vibrant economy while
protecting our natural environment.
· Enable innovation, creativity and entrepreneurship by continuing to build connections and networks with
local talent and supporting sustainable pathways for our current and future
employment requirements, with a focus on Maori employment pathways and business
initiatives.
· Strengthen partnerships and leadership, providing increased opportunity for quality local
entrepreneurship, growth and collaboration, while celebrating, protecting, and
strengthening our unique and distinctive community.
· Focus our efforts to grow those industries and sectors
that provide the most potential for
the Kapiti Coast economy and our community.
Action in each of these areas will be essential if we
are to deliver our vision and enhance our economy. The benefits of an enhanced
economy extend well beyond the direct financial benefits.
The bigger picture includes higher living standards,
affordable housing, a sustainable environment and workforce and a district with
access to services and amenities that support and improve our
communities’ health and well-being; delivered through greater social
amenity and more choices for local residents.
By working together on these areas, we can expect to
see a range of benefits, which could include:
· Attracting new businesses, and growing key existing
sectors, will attract talent and new residents, develop our workforce skills,
grow jobs, and generate increased higher income opportunities. This means there
are more employment opportunities for residents which reduces the need to
commute, as well as greater spend in our local economy enhancing wellbeing.
· Growing and promoting Kāpiti Coast as a
destination, means that new businesses and visitors will have a positive knock
on effect to our economic wellbeing through household income, local jobs,
visitor spend, local services and amenities.
· More generally, the visitor economy allows Kāpiti
Coast to maintain a larger economic footprint than the population could support
by expanding the scale and range of commercial activities that can be
sustained. This creates more choices for residents, for example, the food
and beverage offering in Kāpiti Coast would be greatly reduced in the
absence of the visitor economy.
· Supporting our youth / rangatahi population which not
only offers a sustainable workforce opportunity for Kāpiti Coast but an
opportunity to grow and support young innovators and entrepreneurs. This means
Kāpiti Coast programmes such as Work Ready Kāpiti, Zeal, Startup
Weekend (linked to Techweek), The Māoriland Hub and Pop Up Business School
provide our rangatahi / young people with support, greater choice,
opportunities and stepping stones to a bright future.
· Working in partnership with our community to shape our
district’s economy and environment. This means a more holistic and joined
up approach to enhancing our wellbeing, environment and growing the Kāpiti Coast. Kāpiti Coast District Council
is already the leading Council in NZ for sustainability and climate change, we
reduced our footprint by 76% and will continue working to reduce this further.
This means we will work with Manu Whenua, our community, and businesses to
encourage best practice and continue to improve.
Our strategic pillars
The above priorities and vision, shape the five
pillars, Ngā Pou, of this Strategy, and
emphasise the need for the delivery of the Strategy in partnership and the
importance of ensuring that all parts of our district can benefit from our
actions over the next three years and beyond (Figure 5).
Figure
5: Ngā
Pou
|
Whakapapa
|
Kaitiakitanga
|
Whānau
|
Kotahitanga
|
Manaakitanga
|
|
Positioning the Kāpiti Coast
|
Open for Opportunity
|
Growing Skills and Capability
|
Strengthening Partnerships and
Leaderships
|
Supporting Key Sectors
|
Looking at the objectives of each of these strategic
pillars:
· Whakapapa / Positioning the Kāpiti Coast – focuses on the actions required to enhance the
visibility and attractiveness of the Kāpiti Coast as a destination.
· Kaitiakitanga / Open for opportunity – focuses on the actions that will make the district
more responsive and open to quality growth.
· Whānau
/ Growing skills and capability –
focuses on the actions that support workforce development, creativity,
entrepreneurship and sustainability.
· Kotahitanga
/ Strengthening partnerships and leadership – focuses on the actions that will ensure we have
robust mechanisms for working together at both a local and regional level.
· Manaakitanga
/ Supporting key sectors –
focuses on actions that support the growth of key sectors and industries.
Under each of these pillars we have identified key
actions which will be critical to delivering our objectives and overall vision
(Figure 6). For each pillar we have indicated the medium-term outcomes which we
will be reported and monitor against over the next three years. We have also
identified longer-term outcomes, which we expect to see improvements against
over the next five years, while there is a connection between the medium and
longer term outcomes, progress against the longer term outcomes will also be
influenced by other external factors.
Finally, we have
also identified impacts that align with the priorities of the Strategy and our
vision for the Kapiti Coast's economy, progress against these impact indicators
will largely be outside of our control but they will be important indicators to
measure progress against and to ensure that the actions we are taking are
contributing to growing our local economy for the benefit of all our community.
Our overall approach to measuring outcomes and impacts recognises that, given
the implications of Covid-19, the Kapiti Coast needs to ensure that it
continues to maintain or improve its performance against national and regional
averages and those of our neighbouring districts.
Figure 6: Kāpiti Coast Economic Development Strategy – Strategic
Framework
|
Ngā Moemoea /
Vision
|
Through partnership, support the growth
of a vibrant, diverse Kāpiti Coast economy
that provides increased opportunity,
resilience, and well-being for all
|
|
Ngā Pou / Pillar
|
WHAKAPAPA / Positioning the Kāpiti
Coast
|
KAITIAKITANGA /
Open for opportunity
|
WHĀNAU /
Growing skills and capability
|
KOTAHITANGA / Strengthening partnerships
and Leadership
|
MANAAKITANGA /
Supporting key sectors
|
|
Ngā
Whāinga / Aim
|
Celebrate our rich culture and identity and highlight the opportunities and advantages of the
Kāpiti Coast
|
Facilitate quality growth
|
Enable employment, innovation, creativity and
entrepreneurship and improve capacity for mana whenua participation
|
Delivery and implementation through strengthened partnerships
and leadership and recognises the significant relationship with iwi as mana
whenua
|
Grow industries and sectors that provide the most
potential for supporting improved economic wellbeing
|
|
Ngā Mahi / Actions
|
Develop and deliver the Kāpiti Coast Story
Facilitate and support major events
Build awareness of Kāpiti Coast’s
resiliency and our climate change focus
|
Ensure a welcoming and customer focused approach to
council services
Have a coordinated approach to the facilitation of
key opportunities
Ensure effective regulations that support growth and
protect our environment, including the District Plan
Attract new businesses and agencies to the
Kāpiti Coast
|
Develop a Workforce Plan including a Youth Initiative
and opportunities for Maori, older people and people with disabilities.
Facilitate growth of international education
Advocate for local tertiary and apprenticeship
linkages
Enhance business networking and training opportunities
Develop a business investment and support matching
programme
|
Establish an Economic Development Kotahitanga Board
and finalise the monitoring and reporting framework for the Strategy
Support the development and delivery of a Covid 19
recovery plan
Support actions that enable mana whenua aspirations
Advocate for new and improved essential
infrastructure including electrification of rail to Ōtaki
Support unique economic opportunities in our
communities
Advocate for increased access to affordable housing
to support the growth and retention of local residents
|
Identify opportunities and barriers
experienced by key sectors, including high growth sectors
Develop a district wide Destination Plan to support
the growth of the visitor economy, including strengthened air linkages and
supporting infrastructure such as the Kāpiti Gateway.
Support the development and delivery of a Kāpiti
Creative Industries Plan
Encourage the reduction of waste and emissions
Support development of industry led groups
|
|
Ngā whakaputa
nga takawaenga / Medium term outcomes
|
Increased awareness of the Kāpiti Coast as a
destination
Increase in number of attendees at major events
delivered
|
Businesses recognise Kapiti as a great place to
establish and grow
Key industries and businesses feel supported
More businesses and organisations actively
considering the Kāpiti Coast
|
Improved match between workforce needs and skills
available
Increase in employment and training pathways for
young people and Maori
Increased business networking and awareness of
training and support
|
Increased business engagement
Increased advocacy for Kāpiti Coast
Increase in Government investment into district
|
Targeted actions to support growth of key industries
Growth of visitor economy
Improved resilience and climate awareness across key
industries and businesses
Industry led business groups established
|
|
Ngā whakaputa
nga roroa / Longer term outcomes
|
Increase in visitor numbers and expenditure
Increase in new businesses establishing in district
|
Growth of key industries and businesses
Economic impacts and opportunities of key projects
understood and realised Relocation
of Government Offices to Kāpiti Coast (combined 200+ FTE)
|
Increase level of qualification attainment
Decrease in proportion of NEETs
Decreased rates of unemployment
Increase in investment into key industries and
businesses
|
Increased infrastructure investment in Kāpiti
Coast
Manu whenua aspirations realised
|
Growth of key industries and businesses
Reduction in emissions and increased climate
resilience
Sustainable multi-sector partnership and
collaboration
|
|
Impacts
|
Employment Growth – increase in local
employment options and pathways
|
Mean Income Growth – increase in higher paying
local employment and income generating opportunities
|
Business Unit Growth – increase in businesses
establishing, expanding and moving to the district
|
GDP Growth – increased growth of the local
economy and key sectors.
|
|
|
|
|
|
|
|
|
|
Detailed
action plans
The following section
details the specific actions that form the basis of the implementation plan for
this Strategy. Each of the proposed actions have been prioritised using a
rating of 1, 2 or 3, with those actions rated 1 being the top priority for delivery.
For each action, we have identified the lead agency who will drive the delivery
with identified partners that may have direct involvement or function in an
advisory / information only capacity. We then describe how lead each lead
agency will work with partners to deliver the key action. Finally, we have set
out an anticipated timeline for the start and completion of each
action.
Ngā Pou / Pillar: Whakapapa / Positioning
the Kāpiti Coast
The aim of the Whakapapa / Positioning the
Kāpiti Coast pillar is to celebrate our rich culture and identity and
highlight the opportunities and advantages of the Kāpiti Coast to increase
visitation, support the growth of new and existing businesses and grow the
district’s residential population. Proposed actions
are detailed in Table 1.
Table 1: Whakapapa / Positioning the
Kāpiti Coast – Key Actions
|
Nga Mahi / Action
|
Priority
|
Lead
|
Partners
|
How we will work
|
Delivery
|
|
Complete
the development and implementation of the Kāpiti Coast Destination
Story, including an update and refresh of the Kāpiti Coast destination
website including business research, develop a set of marketing and
promotional material - available for use by the Council, partners and
stakeholders, including business and community. Secure dedicated
marketing resource and budget.
|
1
|
KCDC
|
Iwi,
WellingtonNZ, Chamber, Manaaki, Kāpiti Arts & Creative Industries
group and other Industry Groups, Youth Council.
|
KCDC
will lead this action with input and support sought from our partners.
Further work with iwi, businesses and partners will be required on an ongoing
basis to keep the story relevant and up-to-date.
|
Jul
20 - Ongoing
|
|
Facilitate
and support the delivery of major events and encourage greater business
connectivity and community involvement
|
1
|
KCDC
|
Iwi,
WellingtonNZ, Chamber, Community Boards, Event organisers
|
KCDC
will coordinate a process with partners to ensure greater awareness, support
and leverage of our Major Events.
|
Ongoing
|
|
Building
awareness of local resiliency and climate change opportunities in Kāpiti
Coast, looking both at the opportunity to attract new businesses and to
improve the resilience of existing industries in the district.
|
2
|
KCDC
|
Iwi,
GWRC, WellingtonNZ, Chamber, Community Boards
|
Council
will work with partners to enhance and promote the Kāpiti Coast’s
climate change and resilience opportunities.
|
Sept
20 – Sept 21
|
Ngā Pou / Pillar: Kaitiakitanga / Open for
opportunity
29.
The aim of the Kaitiakianga
/ Open for Opportunity pillar is to adopt a customer focus that
enables all participants in the economy to operate to their full potential and
contribute to a vibrant economy while protecting the natural environment.
Proposed actions are detailed in Table 2.
Table 2: Kaitiakianga / Open for Opportunity – Key
Actions
|
Nga Mahi / Action
|
Priority
|
Lead
|
Partners
|
How we will work
|
Delivery
|
|
Deliver
a welcoming and customer focused approach to council services that works in
partnership with others.
|
1
|
KCDC
|
Iwi,
Industry, Chamber, Community.
|
KCDC
to implement a process for evaluating improvement in our customer approach
across the organisation that is reported to Council and Community annually.
|
Aug
20- Ongoing
|
|
Provide
a coordinated approach to the facilitation of key opportunities
|
1
|
KCDC
|
Iwi,
Industry Groups, WellingtonNZ, Chamber
|
KCDC
will review its activities to ensure a coordinated approach is taken to
facilitate key investment and business opportunities in the district.
|
Aug
20 – ongoing
|
|
Ensure
effective policies and regulations, including the District Plan that support
growth and protect our environment,
ensuring they support quality growth outcomes and enables the effective and
efficient utilisation of available land; that meets the requirements of all
users, including business and housing.
|
2
|
KCDC
|
Iwi,
Development Community, Chamber, Industry Groups, Housing Taskforce,
Community, Youth Council
|
KCDC's
will work with partners to encourage clear communication and understanding of
new policies and regulations and that our community feel that they have had
the chance to be part of this process. A newsletter to industry will be
developed to support this.
|
Ongoing
|
|
Take
a targeted approach to attract new businesses and agencies to the Kāpiti
Coast, with an initial focus on increased Government presence and growing
more higher paid jobs and skills.
|
2
|
KCDC
|
Iwi,
WellingtonNZ, NZTA, Industry, Gvmt agencies
|
Council
will work with partners to drive the importance of Kāpiti Coast as a
District that offers resilience and diversity to businesses and to Government
agencies.
|
Aug
20 – Ongoing
|
Ngā Pou / Pillar: Whānau / Growing
Skills and Capability
30.
The aim of the Whānau /
Growing Skills and Capability pillar to enable innovation, creativity,
entrepreneurship and growth, while building connections and networks with local
talent in the community and supporting sustainable pathways for employment and
improving capacity for mana whenua participation. Proposed actions are detailed
in Table 3.
Table 3: Whānau / Growing Skills and Capability
– Key Actions
|
Nga Mahi / Action
|
Priority
|
Lead
|
Partners
|
How we will work
|
Delivery
|
|
Develop
and deliver a Workforce Plan including a youth initiative
|
1
|
KCDC
/ Iwi
|
Chamber,
Industry, MSD, Work Ready Kāpiti, Youth Council.
|
KCDC
will work with industry to understand workforce needs and skill gaps. KCDC
will work with partners to co-design a Youth Initiative for PGF – He
Poutama Rangatahi Fund and a programme to support connecting people with
disabilities with suitable employers, business opportunities and training
pathways.
|
Feb
20 – Jun 21
|
|
Develop
in partnership with our older persons and industry a program that offers
opportunities for older persons to re-enter the workforce e.g. contract,
mentor in business and supporting young people.
|
2
|
KCDC
|
Iwi,
Grey Power, Kāpiti Retirement Trust, Industry, Chamber, KEDA, Older
Persons Council
|
Chamber
will facilitate with partners the development of a programme for older
persons to re-enter the workforce, mentoring, training, supporting young
people into work etc
|
Feb
21
|
|
Facilitate
the growth and attraction of international education
|
2
|
Kāpiti
Coast College
|
KCDC,
WellingtonNZ, Youth Council, colleges, and schools
|
Council
and WellingtonNZ support Kāpiti's International Education Programme
through promotion and identifying growth opportunities.
|
Ongoing
|
|
Deliver
relevant business workshops and networking events. Create greater visibility
and increase access to training and networking in Kāpiti and Wellington
to support the growth and establishment of businesses in the district.
|
2
|
WellingtonNZ
/ Chamber of Commerce
|
KCDC,
Industry Groups and businesses
|
Wellington
NZ and Chamber will work with partners to understand training, business
workshop needs. Chamber will work with partners to promote networking events
|
Ongoing
|
|
Advocate
for tertiary and apprenticeship linkages that enable pathways, upskilling and
higher incomes linking with the Wellington Regional Workforce Development Strategy
|
2
|
KCDC
/ Iwi
|
Youth
Council, Universities, Weltec / Whiteirea, Wananga WellingtonNZ, Chamber of
Commerce, National Skills Academy
|
Co-designing
fit for purpose programmes based on industry need, growth and demand working
to enable a sustainable workforce and higher incomes.
|
Aug
20 – Ongoing
|
|
Develop
a business investment and support matching programme to support the growth
and establishment of businesses in the district..
|
2
|
KEDA
|
WellingtonNZ,
KCDC, Chamber of Commerce
|
Kick
Start Kāpiti will develop this programme with support from its partners
by way of advice and promotion.
|
Aug
20 – Dec20
|
Ngā Pou / Pillar: Kohahitanga /
Strengthening Partnerships and Leadership
31.
The aim of the Kohahitanga / Strengthening
Partnerships and Leadership pillar to achieve effective delivery and
implementation of this Strategy through strengthened partnerships and
leadership and recognise the partnership with iwi as mana whenua. Proposed
actions are detailed in Table 4.
Table 4: Kohahitanga / Strengthening Partnerships and Leadership – Key Actions
|
Nga Mahi / Action
|
Priority
|
Lead
|
Partners
|
How we will work
|
Delivery
|
|
Establish
an Economic Development Kotahitanga Board, which will be capability based and
led by an independent chair and finalise the monitoring and reporting framework
for the Strategy
|
1
|
KCDC
/ Iwi
|
Drafting
Group, Chamber, KEDA
|
KCDC
will work with Partners and Stakeholders to finalise an appropriate model and
Terms of Reference to setup and implement.
|
Aug
20
|
|
Support
the delivery of actions identified by iwi that enable the aspirations of mana
whenua.
|
1
|
Iwi
|
KCDC,
WellingtonNZ, industry, GWRC, DoC
|
Te
Whakaminenga o Kāpiti will work with partners to shape actions and how
they will be delivered for mana whenua.
|
Ongoing
|
|
Support
the development and delivery of Covid 19 recovery plan for the Kapiti Coast
|
1
|
KCDC
|
Iwi,
Industry, Wellington NZ, Govt, Chamber, Community
|
KCDC
will work with Partners and Stakeholders to develop and implement a recovery
plan
|
Aug
20 - Ongoing
|
|
Advocate
for increased access to affordable and social housing to support the growth
and retention of the local residents.
|
1
|
KCDC
/ Iwi
|
Community
|
Advocate
to Government to increase investment and support for increased social and
affordable housing by completing an analysis of the current housing
availability and impacts on community and personal wellbeing.
|
Sep
20 - Ongoing
|
|
Advocate
for improved transport infrastructure including the extension of the
electrification of rail to Ōtaki as a priority to support growth.
|
2
|
KCDC
|
WellingtonNZ,
NZTA, Elevate Ōtaki, Iwi, Community Boards, KEDA Chamber
|
Lobby
GWRC and Government's Transport Minister, as a District on the significant
economic impact.
|
Ongoing
|
|
Support
Elevate Ōtaki activities with the ongoing work pertaining to the
expressway and future opportunities.
|
3
|
Elevate
Ōtaki
|
KCDC,
Iwi, Ōtaki Community Board
|
Elevate
Ōtaki will continue to progress actions that came out of their
Ōtaki Business Survey.
|
Ongoing
|
|
Support
the redevelopment of the Waikanae Library in the Waikanae Town Centre
|
3
|
KCDC
|
Waikanae
Community Board, Iwi, Businesses, Destination Waikanae
|
Establish
a project advisory group inform the project vision, objectives and analysis
of potential future building options
|
June
20 - Ongoing
|
|
Support
the Wainuiwhenua project, Paekākāriki to understand the economic
impact of the proposal.
|
3
|
Wainuiwhenua
project
|
GWRC,
Iwi, Paekākāriki Community Board, KCDC, DoC
|
We
will support the Wainuiwhenua Project and partners to understand the economic
impact of the proposal.
|
Ongoing
|
Ngā Pou / Pillar: Manaakitanga / Supporting
Key Sectors
32.
The aim of the Manaakitanga /
Supporting Key Sectors pillar to grow industries and sectors that
provide the most potential for supporting improved economic wellbeing. Proposed
actions are detailed in Table 5.
Table 5: Manaakitanga / Supporting Key Sectors – Key
Actions
|
Nga Mahi / Action
|
Priority
|
Lead
|
Partners
|
How we will work
|
Delivery
|
|
Undertake
research to identify how best to support our high growth sectors, their
potential for further growth and current constraints and opportunities for
growth.
|
1
|
KCDC
|
Industry,
WellingtonNZ, Iwi
|
KCDC
will work with WellingtonNZ to identify and understand our high growth
sectors which will inform an industry specific growth plan.
|
Aug
20 – Jul 21
|
|
Develop
and implement a district wide Destination Plan which links into the Regional
Destination Plan.
|
1
|
WellingtonNZ
/ KCDC
|
Manaaki
Kapiti, Iwi, Industry
|
KCDC
will work with partners to develop and implement our Visitor Destination Plan
including strengthened air linkages and supporting infrastructure such as the
Gateway project.
|
Aug
20 – Mar 21
|
|
Support
the Kāpiti Creative Industries cluster group to develop the Kāpiti
Creative Industries Action Plan including attracting investment to assess the
feasibility of establishing a Creative Hub, skills development and visitor
attraction projects.
|
1
|
KACI
|
KCDC,
Kapiti Chamber of Commerce, WellingtonNZ, MBIE, Iwi.
|
KACI
will seek input, advise, and support from its partners to develop and
implement their industry action plan, including the identified actions
relating to the Creative Hub, skills development and visitor attraction
projects.
|
Jun
20 – Mar23
|
|
Encourage
the reduction of waste and emissions as both a way to cut costs but also have
a positive environmental impact
|
2
|
KCDC
|
Industry/business,
iwi, Chamber of Commerce
|
KCDC
will work with partners to promote that we provide waste audits for
businesses, support zero waste major events and will focus on working with
developments / builders to reduce waste from building
|
Sep
20 – ongoing
|
|
Support
the development and ongoing growth of industry led groups.
|
2
|
Industry
|
KCDC,
WellingtonNZ, education providers, Chamber, KEDA
|
Support
industry groups to identify their roadblocks to growth, training needs and wider
support opportunities and lobby on their behalf.
|
Ongoing
|
Accountability
33.
This section describes how the Economic
Development Strategy and Implementation Plan will be delivered with
transparency and accountability. This includes details on the approach to:
· Governance
· Prioritisation
· Monitoring and reporting
· Review
· Implementation timeline
Governance
34.
For all partners and stakeholders,
the ongoing arrangements for governance and delivery of this strategy and
implementation plan are as important as the proposed actions. There is
recognition that governance needs to be consistent, continuous, and effective.
35.
It is the shared view of Council,
our partners and stakeholders, that the governance of this strategy should be
independently led, and council supported with future transition to a more independent model. All partners and stakeholders are committed to
governance principles based on:
· Transparency
· Accountability
· Stewardship
· Integrity
· Trust
36.
In this context, independence is
critical, but there is a need to ensure that partners and stakeholders work together
as a district to delivery this strategy. Recognising this, it is agreed that:
· the Economic Development Kotahitanga Board is
established
· an independent chair is appointed by Council to build
trust, pull together a strong board and provide a unified strategic direction
· the board will be selected based on capability and
board members need to be able to work productively with multiple partners and
stakeholders within and outside the district
· a council representative will be an ex-officio member
of the board
· local iwi will be fully represented on the board
· council will provide support to the board.
· A separate Terms of Reference Agreement will be
developed and agreed with the Board.
37.
It is proposed that the initial
core responsibilities of the Board would focus on overseeing the Economic
Development Strategy, advocating for the Kāpiti Coast and for economic
development activities in the district, and being a relationship broker, with a
focus on the establishment of strategic relationships to progress economic
development opportunities.
The Board will also play an important role in finalising and agreeing the
monitoring and reporting framework for the Strategy. This recognises that given
the Covid-19 pandemic, there is a need to understand more fully the economic
impacts on the local economy and how these might effect our economic
performance and growth
Prioritisation
38.
The detailed action plans set out
previously contain a significant number of actions that will be progressed by
the Council and its key partners over the coming years. Looking across the
strategic pillars, Table 6 sets out each of the priority actions for year
1.
Table 6: Year 1 – Priority Key Actions
|
Pillars / Ngā Pou
|
Year 1 Priority Action
|
Delivery Timeline
|
|
Positioning
Kāpiti Coast / Whakapapa
|
Deliver
the Kāpiti Coast Story
|
Ongoing
|
|
Open
for Opportunity / Kaitiakitanga
|
Provide
a coordinated approach for key investment and business opportunities
|
Aug
2020 – Ongoing
|
|
Growing
Skills & Capability / Whānau
|
Develop
a Kāpiti Coast Workforce Plan, including youth initiative
|
Feb
20 – Jun 21
|
|
Supporting
key sectors / Manaakitanga
|
Develop
a Kāpiti Coast Destination Plan
and a strategy for one other key
sector
|
Aug
20 - Jun 2021
|
|
Strengthening
Partnerships and Leadership / Kotahitanga
|
Establish
an Economic Development Kotahitanga Board and finalise the monitoring and
reporting framework for the Strategy.
|
Aug
20
|
Monitoring and Reporting
39.
Monitoring progress and making recommendations
for the future is critical to a well-functioning Strategy and Implementation
Plan. It helps us know what is working and what might need to change. These are
important mechanisms for managing risk and holding each other to account if
implementation does not happen as it should.
40.
A half yearly report will be
prepared outlining progress to date against each of the actions, timeframes and
issues and risks. This report will be published with immediacy after each
meeting on the Council’s website. Elements of the report may be withheld
if there are reasons to do so, such as commercial-in-confidence information.
41.
The Chair of the Governance Board
will provide an in-person by-exceptions report to Council at least every six
months to detail progress against the Strategy and Implementation Plan, and
receive advice from elected members at this time on any improvements or
additional actions (which would require sufficient resourcing).
42.
The Chair of the Governance Board
will oversee development of an annual report for publication at the end of Year
1 and Year 2 of operations, identifying progress, risks, and next steps.
Council senior leadership and staff will make themselves available to work with
community members on actions and provide updates, as is deemed reasonable and
fair.
Review
43.
The Chair of the Governance Board
will commission a short (6 week) review mid-way through Year 2 to establish
whether the Strategy and Implementation Plan are on track and the governance is
working effectively. Recommendations will be provided to the Council and
reported on publicly.
The Chair of the Governance Board will initiate planning
for the next three years of the Economic Development Strategy and
Implementation Plan (i.e. 2023-2026) from the beginning of Year 3. In addition,
the annual reporting process will also serve as a mechanism for reviewing
progress and establishing future year priorities.
GDP
and growth
44.
GDP for the Kāpiti Coast
District was almost $2 billion in 2019 (2019 prices), growing by 1.5% on the
previous year. This was only half the rate of growth New Zealand experienced,
with grow of 3% between 2018 and 2019.
45.
Key sectors that contributed to
our GDP in 2019 include:
· Health care and social assistance - 10.2%
· Rental, hiring and real estate services – 9.8%
· Professional, scientific and technical services
– 9.8%
· Construction - 9.2%
· Manufacturing – 9.1%
· Retail trade – 6.4%
· Education and training -4.4%
These industries are also our biggest employers,
making up 70% of total filled jobs in the district. (More detail is provided in
the following sections on key industries and employment).
Appendix 1Figure 7: Proportion
of GDP 2019
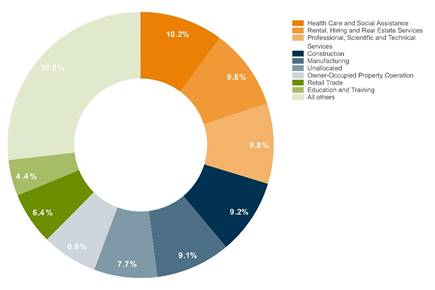
Source:
Infometrics
46.
Over the last 10-years, economic
growth in the district averaged 2.4% p.a. compared with an average of 2.5% p.a.
nationally.
47.
Health care and social assistance,
and the professional, scientific and technical services industries were the two
biggest contributors to economic growth during this time.
48.
Immediate future growth is
expected to be negative as a result of Covid 19 impacts. The districts economy
is predicted to contract by 7% over the year to March 2021. While the national
economy contracts by 8%. The construction and retail industries will experience
the largest decline in GDP over this time period.
Key industries
Construction
49.
Construction was the third largest
contributor to economic growth over the past decade. In 2019, construction
contributed $184m to GDP (9.2% of total GDP).
50.
In 2019, it was the largest
industry employer in the area. 2,805 people were employed in construction,
making up 15.9% of total filled jobs in the district.
51.
Construction is also an important
industry for those who are self-employed. 1,174 people were self-employed in
the construction sector. This is 41.9% of total employment in the construction
industry in 2019.
52.
House construction was the largest
employer within the construction industry in, comprising 594 of all jobs in the
industry, an increase of 44 jobs in the last year to March 2019.
53.
Large infrastructure investments
in the area also contribute to construction’s importance in the
district’s economy. Transmission Gully, a 27 km, 4 lane motorway which
runs from Paekākāriki (in the Kāpiti Coast District) south to
Linden (in Tawa), is likely to be completed by 2021. An expressway from Peka
Peka to Ōtaki is also expected to be open to traffic by 2021.
54.
Future projects include the
construction of a four-lane highway from Ōtaki to north of Levin by 2029.
Together these projects comprise a substantial portion of the Wellington
Northern Corridor. They will provide increased connectivity to the coast and
help support the construction industry long term.
55.
In the short term, Infometrics
expects that the amount of money spent on construction projects overall will
continue to decline due to Covid-19 impacts. This is expected to rise between
2022-25 as investment begins after a period of historically low construction
volumes and the government tries to stimulate the economy through
infrastructure projects, and housing demands continue.
56.
GDP for the industry is expected
to fall by $19.2 million between March 2020 and March 2021. Employment in the
industry is expected to fall by 326 jobs between 2020 and 2021 (a decrease of
11.6%). With this lower construction work likely to see the largest reduction
in Māori employment.
57.
Health care and social assistance
58.
The health care and social
assistance industry is the largest contributor to GDP in the district worth
$203.3 million in 2019 (10.2% of total GDP). It contributes a much higher
percentage towards GDP in the Kāpiti District than New Zealand as whole,
with the sector making up only 5.8% of national GDP.
59.
The industry is our second largest
industry employer, employing 2,540 (14.4% of total filled jobs) in 2019 and it
continues to grow. While a small number of jobs (23, a reduction of 0.9%) are
expected to be lost by March 2021 the industry’s strength will remain
over the next year and likely in the medium to long term. GDP of the industry,
in the Kāpiti district is forecast to increase by $0.61 million (or 0.3%)
between March 2020 and March 2021.
Aged care and support
60.
Aged care and support is the
largest driver of growth within the health care and social assistance industry.
Made up of aged care residential services, other residential services and other
social assistance services. It employs almost 62% of those working in the wider
health care industry (1,562 filled jobs in 2019).
61.
Within this figure, aged care
residential services remain the largest employer, employing 936 people in 2019.
This accounted for 5.3% of total employment in Kāpiti Coast in 2019.
62.
The aged care and support sub
industry is expected to continue growing in Kāpiti. Pre-covid projections
forecasted strong employment growth over the next 5-years for the industry.
Professional, scientific and technical
services
63.
The professional, scientific and
technical services industry was the third largest contributor to GDP for
Kāpiti, GDP for the industry was $195 million in 2019 (9.7% of total GDP).
64.
Between 2009 and 2019 the industry
added $67 million to the Kāpiti Coasts total GDP, making it the second
largest contributor to economic growth over the last 10 years. This growth is
reflected in employment growth figures which have averaged 4.0% since 2000.
65.
The industry is currently our
fourth largest employer, filling 1,650 (or 9.3% of total filled) jobs to March
2019. This figure is up by 2.9% on 2018 employment figures, ahead of the
national growth of 1.8% for the industry.
66.
Covid-19 will impact this industry
in the short term. Over March 2020-2021, this industry is expected to
experience around 140 jobs losses (a reduction of 8.3%). Early estimates for
the year ended March 2021 see GDP in industry reducing by 6.3% (the equivalent
of $12.6 million).
Retail
67.
The retail trade industry is the
districts eight largest contributor to Kāpiti Coast’s GDP, with GDP
of $128m in 2019 (6.4% of total GDP). This is growth of 3.6% on 2018.
68.
Employment was 2,146 in 2019. This
was 12.1% of total filled jobs for the district, making it our third largest
single employer by industry. Employment growth has averaged 1.1% while industry
growth has averaged 3.1% since 2000.
69.
Unfortunately, retail will take
one of the largest economic and employment hits due to Covid-19. By 2021 around
250 jobs will likely be lost due to Covid-19 (a reduction of 12%) and GDP is
expected to fall by $10 million (or 7.7%). This is a reflection of lockdown
restrictions, reduced tourism activity and reduced household spending.
Education and training industry
70.
The education and training
industry is our 9th largest single industry contributor to GDP,
contributing $87 million to GDP in 2019 (8.8% of total GDP for the district).
71.
1,559 people were employed in the
industry in 2019, making education and training our fifth largest employer. 31
new jobs were created in the industry in the last year.
72.
Education on the Kāpiti Coast
is reputable and strong with 3 colleges, Ōtaki’s tertiary
institution Te Wananga O Raukawa, as well as two Māori immersion
schools and two bilingual units within mainstream schools. We also saw a new
primary school open in 2018, reflecting the growth of our district and this
industry.
73.
Education and training is
relatively immune to the impacts of Covid-19 and growth of the industry in the
district is expected to continue. Employment is expected to increase by 1% (15
new jobs) between 2020 and 2021, while GDP for the industry is predicted to
increase by 0.2% (or $0.19 million).
Creative industries
74.
In New Zealand, the creative
industries do not have a dedicated industry division for statistical purposes
but are calculated based on activity within Arts & Recreation,
Manufacturing and Professional, Scientific and Technical Services. In 2017, the
New Zealand Institute of Economic Research calculated that the creative
industries sector cumulatively contributed $17.5 billion to New Zealand’s
GDP, and its 130,000 workers made up 6% of the national workforce.
75.
In 2019, the Kapiti Coast was
identified as having the fourth highest percentage of our workforce employed in
the creative sector in New Zealand, which is consistent with previous years (Figure 8).
Appendix 2Figure
8: Percentage of workforce employed in Creative
Industries
76.
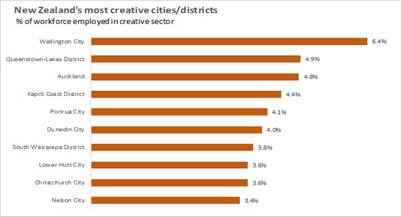
77.
The creative industries have been significantly
impacted by Covid-19 and support is needed to revive the jobs that are likely
to be lost within the sector. Modelling by Treasury suggests that without government intervention, the cultural sector
will be hit roughly twice as hard as the rest of the economy, and 11,000 jobs
could be lost within a 12-month period.
The Kapiti Arts & Creative Industries cluster
group has a key role in supporting the resilience of the sector and delivery of
recommended actions.
Tourism
GDP and employment
78.
In New Zealand tourism does not
have its own industry division for statistical purposes but is calculated based
on activity within several measured industries including accommodation and food
services, transport, retail trade, and arts and recreation services.
79.
In 2019 Kāpiti Coast’s
GDP attributable to the tourism industry was $98.2 million. This equates to
4.9% of total GDP for the district, compared to a 5.4% nationally.
80.
Both international tourist
arrivals and domestic tourism has increased in New Zealand over the past decade
and this increase has also been captured by the Kāpiti District. Growth in
tourism GDP for the Kāpiti Coast has averaged 6.5% over the last decade
compared to 8.1% in New Zealand. In absolute terms, tourism GDP in 2019
for the district was 1.9 times what it was 10 years prior ($52m to $98m).
81.
In 2019, the tourism industry
employed an average of 1,199 people, which equates to 6.8% of the Kāpiti
Coasts total employment in 2019. Employment growth has averaged 0.2% per year
over the last decade.
82.
Tourism in 2020 has experienced
significant reductions in activity due to Covid-19. Accommodation and food, and
retail services relying on tourism will experience job losses and reduced
spending in the district. Employment in accommodation and food alone is
expected to fall by 30% by March 2021 (the equivalent of 388 jobs).
Tourism expenditure
83.
Tourism expenditure captures the
amount of money visitors to the district spend while in the area (it is not the
same as tourism GDP).
84.
In 2019 both domestic and
international visitors spent $177 million in the Kāpiti Coast District, an
increase of 1.3% on 2018 spend.
85.
Domestic visitors make up a larger
portion of spending in Kāpiti (78.5%) than the Wellington Region (68.6%).
Conversely, international expenditure for Kāpiti (21.5%) as a portion of
total visitor spend is lower than the Wellington Region 31.4%. The following
figure illustrates this breakdown.
Appendix 3Figure 10: Domestic
and International tourism expenditure 2019
86.
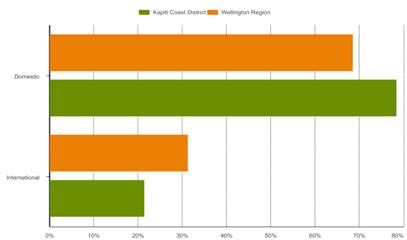
87.
88.
Growth in tourism expenditure has
fluctuated over the past decade and has recently plateaued. Covid-19 is likely
to further cement this trend. Infometrics projects that foreign tourism will
fall by 91% on pre-covid levels, over the next coming year with border restrictions
remaining in place. However domestic spending may only drop by 21%.
89.
Kāpiti’s relatively
high portion of domestic visitor spend (even compared to New Zealand figures)
signals that the area is an attractive area for New Zealanders to visit and so despite
poor economic conditions, there are opportunities to capture domestic traveller
spending over the coming year.
90.
Figure shows how total
tourism spending growth in the Kāpiti Coast District has changed between
2010 and 2019, relative to the rest of the country.
Appendix 4Figure 11: Tourism spending growth 2010-2019
91.
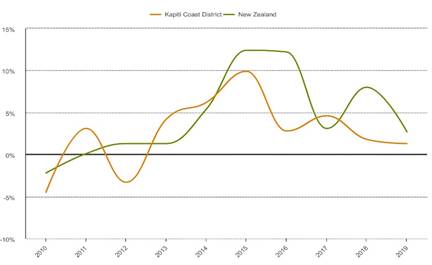
92.
Labour market and skills
Working age population
93.
In 2019, 31,570 people were
between that ages of 15 and 64, meaning 56.4% of our population was of working
age (compared with 64.9% nationally).
94.
This work age population is said
to support a non-working age population of 24,430 people (those between 0-14
and 65+ years of age). This means our dependency ratio is 77.3%. Much higher
than the national ratio of 54.1%.
Appendix 5Figure 9: Age
demographics Kāpiti Coast District compared to New Zealand 2019
95.
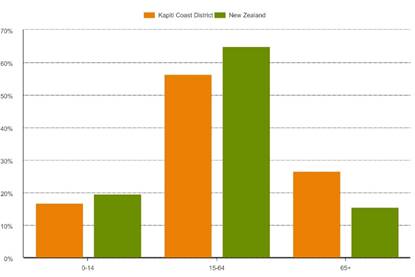
96.
Notes on population generally:
· Total population in 2019 was 56,000.
· Our young people (0-14) represent 16.9% of the
district’s population compared to 19.5% within the national population.
· Our district has a significantly higher proportion of
people 65 years and older, compared with New Zealand (26.7% compared to
15.6%).
Employment
97.
There were a total of 17,693
people employed (total filled jobs) in the Kāpiti Coast District in 2019,
up 1.7% from last year.
98.
Employment is concentrated in
several key industries that are strong contributors to the districts economy.
Over 60.5% of employment is attributed to the following industries:
· Construction – 15.9% of total filled jobs in
2019
· Health care and social assistance – 14.4%
· Retail trade – 12.1%
· Professional, scientific and technical services
– 9.3%
· Education and training – 8.8%
Employment growth in the district has remained
positive over the past 6 years. However, Covid-19 is expected to reduce this
growth to 1% in 2020 and contract in 2021, with negative 9.2% growth predicted.
These levels have not been witnessed at all over the past 20 years.
Just over 1,600 jobs are expected to be lost in the
district, with those in lower skilled jobs taking the largest hit.
Māori are expected to be disproportionately
impacted by these job losses. Māori employment experienced growth of 5.3%,
3.6% and 3.8% in 2017, 2018 and 2019, but this is expected drop to 0.7% in 2020
and contract by 13% in 2021, with 215 Māori estimated to lose their jobs
by 2021. 97 of these lost jobs are in low skilled employment.
Self-employment
99.
A total of 4,938 workers were
self-employed in the Kāpiti Coast District in 2019. 43% of these workers
worked within the construction, and professional, scientific, and technical
services industries.
100.
While the percentage of
self-employed workers has decreased from 28.8% to 27.9%, since 2015, this is
still a significantly higher self-employment rate than the 2019 national rate
of 16.2%.
Unemployment
101.
The unemployment rate for the
district has been steadily declining since 2013 when it reached a 10-year peak
of 6.7%. In 2019 the unemployment rate sat at 3.4% compared to the national
rate of 4.1%, indicating a tight labour market in the district.
102.
Unfortunately, Covid-19 will
reverse this trend. The unemployment rate is expected to be 8.3% by March 2021,
slightly lower than the national rate of 9.0%.
103.
Annual average Jobseeker support
recipients had been declining until 2019, when an average of roughly 1,500 people
received Jobseeker Support each quarter. Recipients of Jobseeker Support grew
by 10.8% between 2018 and 2019 compared to national average growth by 10.6%,
largely following national changes in benefit policies. Unfortunately, this
rate of growth is likely to continue due to declining economic conditions.
Appendix 6Figure 10: Unemployment
rate, annual average 2018 and 2019
104.
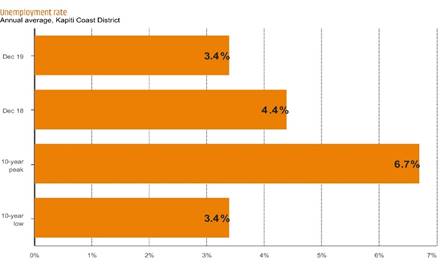
School leaver attainment
105.
Nearly 600 students from
Kāpiti Coast high school leavers in 2018, had achieved NCEA Level 2 or
above. This is the second highest proportion of school leavers with this
attainment level in the broader Wellington area (Figure ). Second only to
Wellington City which had the highest proportion of high school leavers with
NCEA Level 2 or above, at 90%.
Appendix 7Figure 14: Percentage of school leavers with NCEA Level 2 or
above 2018
106.
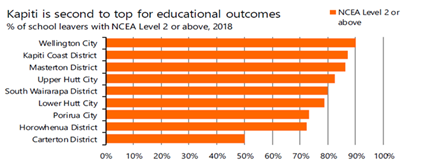
107.
A focus on maintaining strong
educational attainment for Māori will continue to be important on the
Kāpiti Coast. In 2018, 85% of Māori school leavers on the Kāpiti
Coast left school with an NCEA Level 2 or above qualification. This percentage
is much greater than the national average of 59% for Māori.
108.
Kāpiti Coast’s
Māori school leaver attainment at NCEA Level 2 and above was the highest
rate of attainment in the broader Wellington area in 2018 (Figure ).
Appendix 8Figure 15: Percentage of Māori school leavers with NCEA
Level 2 or above 2018
109.
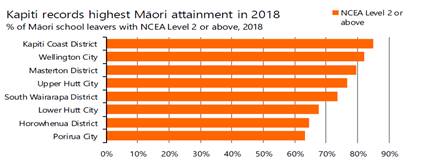
110.
Wellington City had the
second-highest level of Māori attainment, with 82% of Māori leaving
school in Wellington City in 2018 having achieved qualifications for NCEA Level
2 or above.
111.
Despite Kāpiti Coast’s
leaver attainment rates being higher than the national average, Māori
school leaver educational attainment on the Kāpiti Coast still remains
below the non-Māori result (Figure ).
Appendix 9Figure 16: Percentage of Māori school leavers with NCEA
Level 2 or above 2009-2018
112.
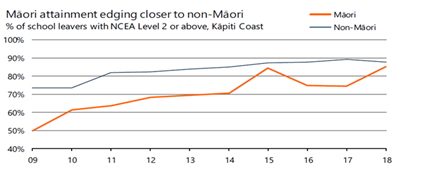
Consumer confidence
113.
Household confidence in the
district appeared strong at the end of 2019. Consumer spending was up 4.1% from
2018 figures, ahead of a 3.3% increase nationally.
114.
Spending in the district fell from
about $8.6 million per week between January and mid-March 2020 to just under $5
million during April 2020, during the lockdown period. Despite lockdown being
lifted, Covid-19 will likely continue to have impacts on this spending with job
losses expected.
Appendix 10Figure 17: Consumer
spending 2016 - 2019
115.
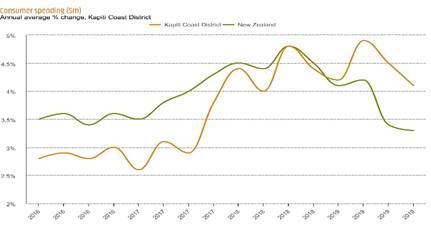
Incomes
116.
Mean average household incomes
have been steadily increasing year on year since 2009. In 2019, mean average
household income for the Kāpiti Coast District (2019) was $92,086, an
increase of 5.4% on 2018.
117.
For comparison, this is lower than
Porirua (City) and New Zealand which had average household incomes of
$133,000and $111,000, respectively. It is however higher than the Horowhenua
District where annual average household incomes were $80,000 in 2019.
118.
Mean annual earnings (a source of
household income) for the Kāpiti Coast was $48,805 in 2019, a 3.5%
increase on 2018 figures. Nationally mean annual earnings were $63,000 in 2019,
(a 3.8% increase on 2018).
Housing
Housing market
119.
Kāpiti Coast’s housing
market remains strong, with house values growing 10% over the year to September
2019 as the number of houses sold eased by 2.0%. As of December 2019, the
average house value was $620,275 for the district. This compares with the New Zealand
average of $699,954.
120.
It appears house values are
growing at a much faster rate in the Kāpiti Coast than the national
average. Values in Kāpiti increased by 8.1% between December 2018 and
2019, compared to an increase by 3.6% for average national values over the same
period.
121.
A buoyant housing market may make
home-owning households feel wealthier, providing a further boost to consumer
spending. However, renters and those looking to buy are struggling as the tight
Wellington housing market continues to influence prices and rents on the
Kāpiti Coast.
122.
The area becoming more attractive
to those living and working outside the coast could increase the workforce in
the district, potentially adding to the skills and talents of this workforce.
However, this is dependent on which demographic is attracted to the area and
whether people can afford increasing prices. Increasing house prices could also
push current residents and those within the current workforce out of the area.
Inequities are likely to become more apparent if this is not managed.
123.
Covid-19 now brings a lot of
uncertainty into the housing market. Current low interest rates are hoped to
reduce the burden for mortgage payments which could encourage some people to
buy. However, job losses, pay cuts and tightening spending generally could
reduce the demand in the housing market overall. The economic downturn could
also increase inequality within the area as those on lower incomes tend to be
disproportionately affected. This could influence who is able to buy and rent
within the districts housing market.
Housing affordability
As house values rise, and average incomes in the area
don’t keep pace, houses in the district are becoming less affordable. The
ratio of current average house values to average household income, the housing
affordability index, was 6.0 in the year to March 2019 for the district, which
was slightly lower than the national index of 6.1.
This index has been rising since 2016, indicating that
housing is becoming less affordable in the district. By 2019 the ratio had
converged to the national ratio, however COVID-19 now brings a lot of
uncertainty as to how affordable housing will be.
Rental affordability
124.
Rentals have generally become more
affordable in the Kāpiti Coast since 2000, however affordability is still
less than the New Zealand average. COVID-19 is also likely to reduce
affordability as average incomes drop.
125.
The table below shows how the
rental affordability index has changed over the past 20 years. This index is
the ratio of average weekly rent to average household income. A higher ratio
suggests that average rents cost a greater multiple of typical incomes, which
indicates lower rental affordability.
126.
The Kāpiti Coast had a rental
affordability index of 0.226 in 2019, higher (and therefore less affordable)
than the New Zealand average of 0.195.
Appendix 11Figure 18: Rental
affordability index 2000-2019
127.
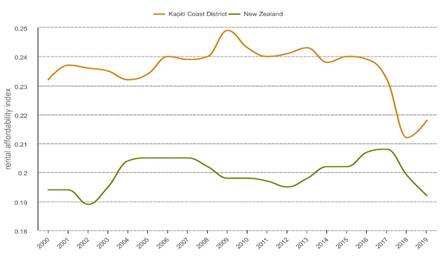
128.
129.
Appendix 2: Definitions
ANZSIC06 industry classifications
130.
This document refers to key
industries throughout. These industries are based on the 1-digit industry
categories from the 2006 Australia New Zealand Standard Industrial
Classification (ANZSIC).
131.
The ANZSIC is a hierarchical
classification of industries with four levels, namely divisions (the broadest
level also referred to as 1-digit categories), subdivisions (3-digit), groups
(4-digit) and classes (7-digit). There are approximately 500 7-digit
industries.
132.
Statistical information, such as
GDP and employment, is collected for each of these industries which are then
collated to provide overviews of. These
133.
Note: tourism and the art and
creative sectors are not part of these industry classifications but are derived
from these industries and their subdivisions, groups, and classes.
Gross Domestic Product
134.
Gross Domestic Product (GDP)
measures the value economic units add to their inputs. Total GDP is calculated
by summing the value added to all goods and services for final consumption i.e.
it does not include the value added to goods and services used as intermediate
inputs for the production of other goods as this would result in double
counting. As a result, GDP estimates should not be confused with revenue,
turnover or gross output. Where referred to in this report GDP is measured in
2019 prices.
135.
136.
Filled jobs
137.
Is simply the number of people in
paid work i.e those employed.
138.
Tourism expenditure
139.
Tourism expenditure captures the
amount of money visitors to the region (both domestic and international) spend
while in the area. It is not the same as tourism GDP but is an input into
calculating tourism GDP.
140.
Tourism GDP and employment
141.
Tourism is not classed as its own
industry under the ANZSIC but figures for tourism GDP are derived from various
sources which collect information on tourism related activity (e.g. Statistics
New Zealand’s Tourism Satellite Account, and guest nights, and visitor
expenditure data from MBIE).
142.
Tourism GDP is used as a basis to
calculate tourism employment. Within each industry it is known roughly how much
of the industries output is associated with tourism. This portion is applied to
the underlying employment levels in each industry to give tourism employment
for each industry. Then summed to provide an indication of the total number of
jobs in a region that are attributable to the tourism industry.
Dependency ratio
143.
Is the number of under 15 year
olds and over 65 year olds as a ratio of the rest of the population (the
working age population). A higher dependency ratio signals that there is a higher
burden on the working age population to support the non-working population.
Household income
144.
Household income captures labour
market earnings (wages, salaries and self-employment) as well as allowances
(e.g. Disability Allowance), benefits (e.g. Jobseeker Support) and
superannuation. Investment income is excluded. Figures for the Kāpiti
Coast District are determined by apportioning income information at a national
level to the district, based on various sources of administrative data.
145.
House values
146.
Is the current average value of
all developed residential properties in the area based on the latest house
value index from QVNZ. It is not the same household price i.e what is sold in
the market, but growth in each house’s prices do influence the measured
house value.
147.
Housing affordability
148.
Is the ratio of the average
current house value to average household income. A higher ratio suggests that
median houses cost a greater multiple of typical incomes, which indicates lower
housing affordability.
149.
Rental affordability
150.
Is the ratio of the average weekly
rent to average household income. A higher ratio suggests that average rents
cost a greater multiple of typical incomes, which indicates lower rental
affordability.
9 Confirmation
of Minutes
9.1 Confirmation
of minutes
Author: Grayson
Rowse, Democracy Services Advisor
Authoriser: Leyanne
Belcher, Democracy Services Manager
|
Recommendations
That the minutes of the Council
meeting on 11 June 2020 be accepted as a true and accurate record of the
meeting.
|
Appendices
1. Council
Minutes 11 June 2020 ⇩ 
|
Council
Meeting Agenda
|
25 June 2020
|
+ MINUTES OF Kapiti Coast District Council
Council Meeting
HELD AT THE Council
Chamber, Ground Floor, 175 Rimu Road, Paraparaumu
ON Thursday, 11 June
2020 AT 09.30am
PRESENT: Mayor
K Gurunathan, Deputy Mayor Janet Holborow, Cr Angela Buswell, Cr James Cootes,
Cr Jackie Elliott, Cr Gwynn Compton, Cr Jocelyn Prvanov, Cr Martin Halliday, Cr
Sophie Handford, Cr Robert McCann, Cr Bernie Randall
IN
ATTENDANCE: Te Whakaminenga o Kapiti Chair Rupene Walker,
Paraparaumu-Raumati
Community Baird Chair Kathy Spiers,
Otāki Community Baird Chair Chris Papps,
Waikanae
Community Baird Chair James Westbury,
Paekākāriki Community Baird Chair Holly Ewens,
Wayne
Maxwell, Natasha Tod, Sean Mallon, Janice McDougall, Mark de Haast (via video),
James Jefferson, Leyanne Belcher, Tanicka Mason, Grayson Rowse, Alison Law,
Angela Bell, Susan Owens
APOLOGIES: None
LEAVE OF None
ABSENCE:
1 Welcome
2 Council
Blessing
The Mayor welcomed everyone to the meeting and read the
Council blessing.
3 Apologies
None
4 Declarations
of Interest Relating to Items on the Agenda
Deputy Mayor
Janet Holborow declared a conflict of interest in item 8.4 Voting in
the Electra Trust Election 2020
on the agenda.
5 Public
Speaking Time for Items Relating to the Agenda
None
6 Members’
Business
(a) Public
Speaking Time Responses
(b) Leave
of Absence
(c) Matters
of an Urgent Nature (advise to be provided to the Chair prior to the
commencement of the meeting)
7 Mayor's
Report
Nil
Cr Elliott thanked the EOC controller Mr James Jefferson for
all his hard work over the COVID-19 pandemic.
8 Reports
|
8.1 Process
for Receipt of Martin Jenkins Independent Organisational Review
|
|
Tim Power took the report as read and answered
members’ questions
|
|
Cr Jocelyn Prvanov left the meeting at 9:42 am.
Cr Jocelyn Prvanov returned to the meeting at 9:43 am.
|
|
Resolution 2020/26
Moved: Deputy
Mayor Janet Holborow
Seconder: Cr Jackie Elliott
1) That
the Council revoke Resolution 2020/4 made at the Council meeting on 14 May
2020.
2) That
Council direct Martin Jenkins and Associates (Martin Jenkins) to release the
Independent Organisational Review of Kapiti Coast District Council (the
Report) in accordance with the following timetable:
a) 15
June 2020 – report released to Simpson Grierson;
b) 19
June 2020 – key findings briefing by Martin Jenkins, and the Report is
released to the Mayor, Councillors and the Chief Executive;
c) 23
June 2020 – detailed briefing by Martin Jenkins to the Mayor,
Councillors, Community Board Chairs, a representative of each of the
Council’s iwi partner organisations and the Chief Executive;
d) 29
June 2020 – Report released to the public.
3) That
Councillors and the Chief Executive issues press releases at the same time
the Report is released to the public.
4) That
at an appropriate time, after the release of the Report, the Chief Executive
tables a short position paper at a Council meeting on the steps needed by
management to progress any relevant recommendations made by the Report.
Carried
|
|
8.2 Amendments
to Standing Orders for Meetings of Council
|
|
Leyanne
Belcher took the report as read and answered members’ questions. Tim
Powers also answered members’ questions.
|
|
Resolution 2020/27
Moved: Cr Gwynn Compton
Seconder: Cr James Cootes
That Council adopt the set of Standing
Orders as at Attachment 1 of this report ‘Amendments to Standing Orders
for meetings of Council’.
Carried
|
The meeting
adjourned at 10.30am
The meeting
resumed at 10.43am
|
8.3 Proposed
changes to the LGFA Borrowing Covenants
|
|
Mark de
Haast took the report as read and took members’ questions.
|
|
Resolution 2020/28
Moved: Cr
James Cootes
Seconder: Deputy Mayor Janet Holborow
That the Council:
1) Appoints
the Group Manager, Corporate Services as proxy to vote on behalf of the
Council at the Local Government Funding Agency’s Special General
Meeting on 30 June 2020, with the Chief Executive of the LGFA as alternate;
2) Agrees
that the proxy or alternate votes in favour of the Local Government Funding
Agency’s proposal as follows:
a) to
increase the foundation policy financial covenant net debt / total revenue
from the current 250% to 280% for local authorities with a long-term credit
rating of ‘A’ equivalent or higher;
b) that
until 2025/26, local authorities with a long-term credit rating of
‘A’ equivalent or higher must comply with the “Alternative
Net Debt / Total Revenue covenant” as below.
|
Alternative Net Debt / Total Revenue Covenant
|
|
Financial Year (Test Date)
|
Net Debt / Total Revenue
|
|
30 June 2020
|
<250%
|
|
30 June 2021
|
<300%
|
|
30 June 2022
|
<300%
|
|
30 June 2023
|
<295%
|
|
30 June 2024
|
<290%
|
|
30 June 2025
|
<285%
|
3) Notes the
amended foundation policy financial covenant of 280% will apply in the
2025/26 financial year and annually thereafter.
Carried
|
|
8.4 Voting
in the Electra Trust Election 2020
|
|
Deputy
Mayor Holborow declared an interest in this item and left the meeting at
10:54 am, taking no part in the discussion nor voting on this item.
Leyanne Belcher took the report as read and answered
members questions.
|
|
Resolution 2020/29
Moved: Cr Robert McCann
Seconder: Cr Jackie Elliott
That Council vote for Kevin Burrows and
Neil MacKay in the Electra Trust 2020 election.
Carried
Cr RAndall voted
against
Cr Holborow
abstained
|
9 Confirmation
of Minutes
|
9.1 Confirmation
of minutes
|
|
Resolution 2020/30
Moved: Cr
Jackie Elliott
Seconder: Cr Robert McCann
That the minutes of the Council meeting on 28 May 2020 be
accepted as a true and accurate record of the meeting.
Carried
|
10 Public
Speaking Time
· Covering
other items if required
· Public
Speaking Time responses
11 Confirmation
of Public Excluded Minutes
Resolution to Exclude the
Public
|
Public Excluded Resolution 2020/31
Moved: Mayor
K Gurunathan
Seconder: Cr Gwynn Compton
That, pursuant to Section 48 of the Local Government Official
Information and Meetings Act 1987, the public now be excluded from the
meeting for the reasons given below, while the following matters are
considered.
The general subject matter of each matter to be considered
while the public is excluded, the reason for passing this resolution in
relation to each matter, and the specific grounds under section 48(1) of the
Local Government Official Information and Meetings Act 1987 for the passing
of this resolution are as follows:
|
General subject of each matter to be considered
|
Reason for passing this resolution in relation to
each matter
|
Ground(s) under section 48 for the passing of this
resolution
|
|
11.1 - Confirmation of
Public Excluded minutes
|
Section 7(2)(b)(ii) - the withholding of the information
is necessary to protect information where the making available of the
information would be likely unreasonably to prejudice the commercial
position of the person who supplied or who is the subject of the
information
Section 7(2)(h) - the withholding of the information is
necessary to enable Council to carry out, without prejudice or
disadvantage, commercial activities
|
Section 48(1)(a)(i) - the public conduct of the relevant
part of the proceedings of the meeting would be likely to result in the
disclosure of information for which good reason for withholding would exist
under section 6 or section 7
|
Carried
|
The Council meeting went into public excluded session at 11.04am.
|
Resolution 2020/32
Moved: Mayor
K Gurunathan
Seconder: Cr Jackie Elliott
That the Council moves out of a
public excluded meeting.
Carried
|
The Council came out of public excluded session 11.06am.
The Council meeting closed
at 11.06am.
...................................................
CHAIRPERSON